What Does One More WordPress Site Cost?
I measured what each extra WordPress tenant on one ePHPm instance costs in RAM, file descriptors, CPU and disk. The sweep ran from 10 to 1000 sites.
ePHPm v0.7.0 shipped per-site multi-tenancy. Point [server] sites_dir at a directory and every Host maps to its own
docroot and its own Turso database file. One process serves all of them. The first question anybody asks about that is
“how many sites fit on a box?” The honest way to answer it is to turn the question around. What does one more site
cost? If you know the marginal RAM, file descriptors, CPU and disk for a tenant, the box size falls out of arithmetic.
So I built multitenant-scalebench to measure exactly that, from
10 to 1000 sites on one instance. The repo is frozen now. The harness moved to scale/ in
ephpm/lab, but the reports and raw JSON stay there as the record. This is the short
version, with the numbers I size with.
The setup
Every data point is a fresh ePHPm instance serving exactly N vhosts (site-0001 through site-N). All N share one
read-only docroot. That’s realistic, since production runs one copy of WordPress core across tenants. It also means
opcache gets shared the way it would in production. What diverges per site is the database. Each vhost gets
<db.dir>/<site>.db, opened lazily and cached under an LRU with a cap. The cap is max_open_dbs (default 256).
There are two workloads. wp-real is real WordPress core with the
ephpm/db-wordpress drop-in, which routes $wpdb to the per-site Turso
database in-process. wp-lite is a WordPress-shaped front controller doing the same ~20 reads per front page
against the per-site DB. wp-lite is not WordPress, and the reports label it every time. But it’s what lets the sweep
reach 1000 sites without provisioning 1000 real installs. Load is a Go closed-loop generator at 128 concurrent
workers. It round-robins the Host header over all N sites with a 3:1:1 mix of front page, permalink and REST.
Every point was run twice. Once at the default cap of 256 and once at 4096, so every site stays open. That second knob turns out to be the whole story.
RAM: about 2.2 MB per open site
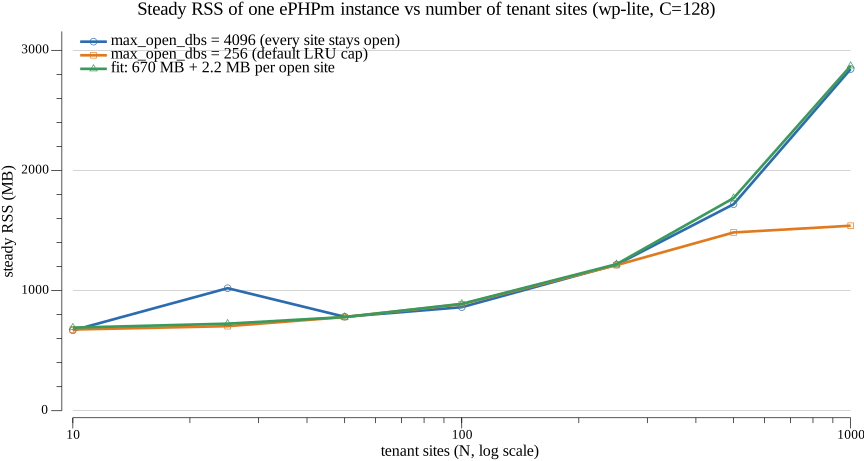
Data: wp-lite tables in REPORT.md. The
RSS columns are read straight from /proc and weren’t affected by the harness bug described below. The N=25,
cap=4096 bump is a measured outlier from a sibling build running on the box, left in rather than smoothed.
With every site open (cap=4096), RSS climbs linearly from 1.2 GB at 250 sites to 2.8 GB at 1000: (2844 - 1216) / (1000 - 250) = 2.17 MB per open site. That’s the open Turso database, its WAL and the per-site KV store. On top of that is a baseline of about 0.67 GB. That’s the PHP ZTS runtime, opcache and the server.
That baseline is not a floor, though. It’s what ePHPm’s autotune picked on a 62 GiB box. opcache.memory_consumption
is 18% of RAM clamped to 64-512 MB, so this box hit the 512 MB ceiling. Workers are clamp(vCPUs, 2, 32). On a 1 GB
VM the same math works out to roughly 250-350 MB of baseline. That one is derived from the autotune formula, not
measured.
With the default cap, the LRU does its job. Past 256 sites the curve goes flat. RSS sits around 1.5 GB whether you
have 500 sites or 1000. The fd count follows the same pattern. It’s about 2 per open site (the .db and its
-wal) plus ~140 base. That’s 641 fds at N=250 and 2,141 at N=1000 with cap=4096. Under the default cap N=1000 used
790.
So the RAM formula is:
RSS ≈ baseline + 2.2 MB × min(N, max_open_dbs)
fds ≈ 140 + 2 × min(N, max_open_dbs)
The cliff: more active sites than max_open_dbs
The LRU bounds memory, but it isn’t free. If more sites are actively receiving traffic than the cap allows, nearly every request becomes a miss. Open a file, evict an idle site, serve. In the original sweep that path ran through a single registry mutex held across the file open. That was deliberate, to guarantee one Turso handle per file. Throughput collapsed while CPU dropped, because threads were blocked, not working.
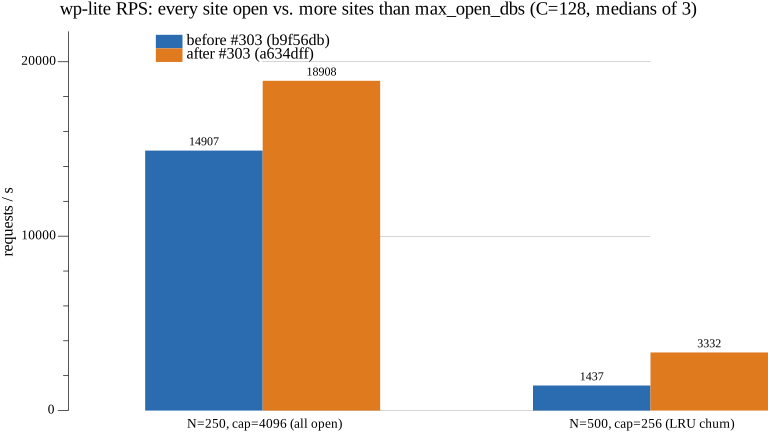
Data: points 1 and 2 of BEFORE-AFTER.md, medians of 3 interleaved runs per binary, wp-lite, 32 cores.
Before the fix, 250 warm sites served 14.9k RPS on 16.5 cores. 500 sites under the default cap fell to 1.4k RPS on
2.1 cores. ePHPm #303 replaced the global map-plus-mutex with permanent
per-site slots, each with its own lock. Opening site A no longer blocks resolving site B. That lifted the churn case
2.3x to 3.3k RPS on 10.5 cores and the warm case to 18.9k. The churn case is still 5.7x slower than warm, though. So
the rule doesn’t change: set max_open_dbs at or above the number of sites that are active at the same time. The
LRU is a memory safety valve for lots of idle tenants, not a performance feature.
CPU: real WordPress is the cost, not the tenancy
wp-lite tells you about the multi-tenant plumbing. For sizing you want real WordPress, and real WordPress is CPU-bound. I ran wp-real at 50 sites on the fixed harness (more on that below). It did 266-272 RPS with 28 of 32 cores busy. That’s 9.5-9.7 front-page requests per second per core, or about 105 ms of CPU per request.
The more useful finding is that the number didn’t move with site count. The original wp-real sweep ran 10, 50, 100 and 250 sites. Throughput was flat at 243-253 RPS across all four. Those runs carried a small harness penalty, about 7% low, but the same penalty at every N. Adding a tenant doesn’t make any request more expensive. It spreads the same saturated cores across more sites. CPU scales with traffic, not with site count.
Disk: a fraction of a megabyte per fresh site
This is the number that changed my sizing sheet the most. My first draft of it had a guess of 2 MB per WordPress
database. I measured 250 real wp-admin/install.php installs. A fresh WordPress database (default 1 post, 1 page,
1 comment) is ~124 KB once the WAL is checkpointed. It’s ~660 KB if it still carries the install-time -wal
(LKE-SIZING.md,
commit 2f705de).
I re-measured that on the v0.7.0 release binary with WordPress 7.0.3. I made 20 fresh sites, each installed through the web installer onto its own Turso database. Two things showed up:
- Right after install, each site was a 4 KiB
.dbplus a 716,912-byte-wal. The whole install lives in the WAL, and it stayed that way through a clean shutdown of the server. So “uncheckpointed” isn’t a corner case. It’s the state a freshly installed site sits in, about 704 KiB per site. - After
PRAGMA wal_checkpoint(TRUNCATE), every database was exactly 155,648 bytes (152 KiB).integrity_checkreturnedok. That’s a bit above the original 124 KB. I’d guess the WordPress version is the difference, but I don’t have the original run’s version recorded to prove it. Of the 152 KiB, 80 KiB iswp_options.
Either way the order of magnitude is the point. A fresh WordPress site is a fraction of a megabyte, not several.
A real preview with a theme, plugins and content will be a few MB. Still small, but size disk with headroom if your previews aren’t close to fresh.
Putting it together
Per marginal WordPress site on one ePHPm instance:
| Resource | Cost per site | Bounded by |
|---|---|---|
| RAM | ~2.2 MB while its DB is open | max_open_dbs |
| File descriptors | ~2 while its DB is open | max_open_dbs |
| CPU | ~105 ms per front-page request | traffic, not site count |
| Disk | ~0.12-0.7 MB fresh | nothing; it’s a file |
That gives two very different sizing answers depending on traffic.
Lots of mostly idle sites (PR previews). At 5 req/s across the whole service you need about half a core.
5,000 fresh sites is 0.6-3.3 GB of disk. With max_open_dbs = 64 the open-DB term is ~140 MB on top of the
autotuned baseline. That’s one 1 vCPU / 1 GB node. The real risk there isn’t aggregate compute. It’s one preview
getting crawled and eating the only core. That’s a per-site rate limit problem, not a bigger-node problem.
Tenants under real sustained traffic. Now it’s CPU, and only CPU:
cores_needed  = ceil(peak_realWP_RPS / 9.5)
RAM_per_pod   = autotuned_baseline + 2.2 MB × min(sites_per_pod, max_open_dbs) + headroom
disk_per_pod  = ~0.7 MB × sites_per_pod
fd_per_pod    = 2 × max_open_dbs + 200      # set RLIMIT_NOFILE above this
max_open_dbs >= sites active at the same time
Take a 3-node LKE cluster with N+1 headroom. That works out to Dedicated 8 vCPU nodes for ~150 peak RPS and Dedicated
32 vCPU nodes for ~450-600. RAM is never what you’re buying. At 5,000 sites the per-site footprint is a few GB. You buy
cores. To go past what one pod’s cores give you, you go wider, not bigger. One constraint applies once you have more
than one pod. Turso opens each <site>.db from exactly one process. So a site lives on exactly one pod and traffic has
to be routed to it by Host.
The asterisk on the throughput numbers
Halfway through this work I found that my harness had been launching the server with its working directory on
/mnt/c. That cost the light workload about 4x. It also produced a confident, wrong story about the registry mutex
being the ceiling. That one gets its own post. Every throughput
number above is from the fixed harness. The RSS, fd and disk numbers never depended on it. The wp-real per-core figure
barely moved because WordPress’s own CPU cost swamped the penalty.
And the usual caveat: this is a 32-vCPU WSL2 dev box. Take the shape and the per-site coefficients. Then measure one pod on your target hardware to calibrate the absolute RPS.
How I measured
- Host: WSL2 on Windows 11, AMD Ryzen 9 5950X (16 cores / 32 threads), 62 GiB RAM, run directory on native ext4.
- Sweep binary: ePHPm
3352445(v0.7.0 per-site multi-tenancy, 2026-08-14),cargo xtask release 8.5, PHP 8.5.7 ZTS. Before/after binaries:b9f56dbanda634dff. scripts/run_sweep.shwithNS="10 25 50 100 250 500 1000" CAPS="256 4096" C=128, 8 s warmup, 20-25 s measured.scripts/sample.shsamples RSS, CPU and fds from/proconce a second.- Disk re-measure: ePHPm v0.7.0 release (
ephpm-v0.7.0+php8.5.7-linux-x86_64), WordPress 7.0.3 plus the db-wordpress drop-in. 20 sites installed with the harness’sscripts/seed_wp_real.sh. Sizes came fromls -l/du -cbwhile running and after SIGTERM. Thensqlite3 <db> "PRAGMA wal_checkpoint(TRUNCATE);"andPRAGMA integrity_check, with per-table sizes from thedbstatvirtual table.
Links
- ephpm/multitenant-scalebench:
report/REPORT.md,report/BEFORE-AFTER.md,report/LKE-SIZING.md, raw JSON underresults/ - ephpm/lab, where the harness continues under
scale/ - ePHPm #303: per-site registry locking
- ephpm/db-wordpress: the
$wpdbdrop-in - Related: What an Overloaded PHP Server Actually Returns