What an Overloaded PHP Server Actually Returns
Closed-loop benchmarks can't show you overload. An open-loop load generator with an error taxonomy showed ePHPm returned nothing at all, and then verified the fix.
Ask most people what their PHP server does when it’s overloaded and you’ll hear “it returns 503s.” Ask them how they
know and it usually comes down to a config setting they read about. I was in that camp for ePHPm.
We had a [server.limits] max_connections knob, and the docs said it returned 503 at the cap. Every benchmark we had
ever run reported zero errors under heavy load. Then I wrote a load generator that could produce overload. The honest
answer was that an overloaded ePHPm returned nothing at all.
This post is about the measuring more than the fixes. It covers three things:
- why the benchmark you probably have can’t see overload
- what a load generator has to do differently
- how to classify what comes back
The data comes from multitenant-scalebench (report/SHEDDING.md).
The re-run that verified the fixes is in ephpm/lab (docs/shed-verify-v070.md).
Closed-loop benchmarks can’t overload anything
Almost every HTTP benchmark tool you’ve used is closed-loop. That includes wrk, hey, oha, k6 with a fixed VU
count and my own loadgen up to that week. You pick a concurrency, say 128 workers. Each worker sends a request, waits
for the response, then sends the next one. There are never more than 128 requests in flight.
That sounds reasonable until you think about what happens when the server slows down. The workers slow down with it. The server is never asked to do more than it’s already doing, so backpressure shows up as latency and nothing else. I had run 128 and 512 workers against ePHPm and both engines came back with 0 errors. That result was true. It also told me nothing about overload.
Real traffic doesn’t wait for you. Users, crawlers and the retry loop in someone else’s service arrive at whatever rate they arrive at. They don’t care whether you’ve answered the last request. That’s an open-loop arrival process. It’s the only way to find out what your server does when it’s handed more work than it can finish.
An open-loop mode for the load generator
The loadgen in multitenant-scalebench is plain Go with no dependencies. I added an open-loop mode
(b9ccdd1) behind three flags:
-ratefor arrivals per second-arrival const|poissonfor the inter-arrival process-timeoutfor the per-request client timeout
The core of it is a scheduler that fires every request at its scheduled instant on its own goroutine. It doesn’t care how many are still outstanding:
next := start
i := 0
for {
	if cfg.arrival == "poisson" {
		next = next.Add(time.Duration(rng.ExpFloat64() * interval))
	} else {
		i++
		next = start.Add(time.Duration(float64(i) * interval))
	}
	if next.After(end) {
		break
	}
	if d := time.Until(next); d > 0 {
		time.Sleep(d)
	}
	if lag := time.Since(next).Nanoseconds(); lag > schedLagMaxNs.Load() {
		schedLagMaxNs.Store(lag)
	}
	measured := !next.Before(measStart)
	// ... pick a Host and path, then:
	wg.Add(1)
	go func(measured bool, host, path string) {
		defer wg.Done()
		cur := inFlight.Add(1)
		defer inFlight.Add(-1)
		// track in-flight high-water mark, do the request, record a sample
	}(measured, host, path)
}
Two details matter more than they look. First, the schedule is computed from start, not from the previous send. A
slow time.Sleep doesn’t quietly lower the rate. Second, the generator records its own worst scheduling lag. An
open-loop test is only open-loop if the generator keeps its schedule. If it falls behind, you’re back to measuring the
generator. In every run in this post the max lag stayed under 90 ms. On the runs where the server stopped answering,
the in-flight ceiling climbed to rate x timeout. That’s about 4,000 at 400/s and 8,000 at 800/s. That’s how you know
the arrival process was independent of the server. The generator kept firing into a server that wasn’t answering.
The HTTP transport also has to be sized for it. A closed-loop run needs 2 x workers idle connections. An open-loop
flood can legitimately hold thousands in flight, so the open-loop mode raises MaxIdleConnsPerHost to 8192.
An error taxonomy, not an error count
The closed-loop report had one errors number. Under overload that number hides everything interesting, because the
things that go wrong are different things. The open-loop report splits out the status code distribution (200, 429,
503, …). Requests that never got a status at all go into a separate transport-error taxonomy:
func classify(err error) string {
	var ne net.Error
	if errors.As(err, &ne) && ne.Timeout() {
		return "timeout"
	}
	if errors.Is(err, context.DeadlineExceeded) {
		return "timeout"
	}
	s := err.Error()
	switch {
	case strings.Contains(s, "Client.Timeout"):
		return "timeout"
	case strings.Contains(s, "connection refused"):
		return "conn_refused"
	case strings.Contains(s, "connection reset"):
		return "conn_reset"
	case strings.Contains(s, "EOF"):
		return "eof"
	default:
		return "conn_error"
	}
}
Each bucket means something different operationally. A 503 is the server choosing to say no. A timeout is the
server saying nothing. conn_refused in the middle of a run usually means the process is gone. conn_reset and
eof mean something died mid-response. “We had 4% errors” can mean any of those, and only one of them is healthy.
There are two other rules. Latency percentiles are computed over 2xx successes only. A p50 that includes 10 s timeouts is a number about your client config, not your server. The report also includes a per-second series of 2xx completions. That series turned out to be the most useful thing in the report. It shows the shape over time: stabilizing, or a death spiral.
The first run: nothing sheds
The workload was real WordPress with the ephpm/db-wordpress drop-in on
per-site Turso databases. It ran 10 sites on a 32-core WSL2 box. Closed-loop capacity for that workload on that binary
was about 262-276 RPS. So I flooded fresh instances at 400/s (about 1.5x capacity) and 800/s (about 3x) for 60 seconds,
with a 10 s client timeout. The matrix covered both FPM engines with and without max_connections = 256. The engines
were spawn_blocking, the default, and the new pool engine from #296.
After each flood came a 30 s idle cooldown. Then a light probe against the same instance checked whether it recovered.
The headline from SHEDDING.md:
- With default settings, nothing sheds. Zero 503, zero 429, zero 5xx of any kind. Every arrival ended as either
a 200 or a client timeout. At 800/s on
spawn_blocking, that was 48,001 arrivals and 48,001 timeouts. max_connections = 256fired on 0.5-9.9% of arrivals and protected nothing. Most excess arrivals never got far enough to be rejected. The accept loop couldn’t keep up and the listen backlog filled. Dials hung until the client gave up. And for the ones it did reject, reading the code showed the rejected connection was still dispatched to hyper and served. The limiter returnedNoneon rejection, which was indistinguishable from “no limiter configured.” The 503 was a courtesy note.spawn_blockingwedged and never came back. RSS climbed to 5.4-6.2 GB and stayed there after the flood ended. The recovery probe got zero responses in all four configs. The pool engine stayed flat at 0.56-0.75 GB and recovered within 30 s. It recovered fully with the connection limit set and partially without it. One pool instance never got probed, because of the next bullet.- 3 of 10 flooded instances died of the same SIGABRT. A thread-local destructor in the DB bridge panicked during thread teardown. It happened once mid-flood, once during the idle cooldown after a flood it had survived, and once at SIGTERM.
The wedge has a simple mechanism once you see it. spawn_blocking closures go into tokio’s blocking queue, which is
unbounded and can’t be cancelled. When a client times out and disconnects, its PHP request is still sitting in that
FIFO. Tens of thousands of abandoned requests queue ahead of any new request. Each one is worth 100-500 ms of PHP. At
about 260 RPS of capacity that’s minutes to hours of work for clients that already left. The pool engine’s hyper task
waits for a slot in a bounded channel instead. When the client disconnects, hyper drops the task and the
queued-but-unstarted request goes with it.
None of this showed up in the closed-loop runs. Same binary, same box, same workload.
The fixes, and measuring them the same way
That report turned into issues and PRs within a day:
- #299, serve-after-503, closed by #298
along with a
[server] preview = truepreset that fills in safe limits for small preview boxes - #300, the SIGABRT, and #301, request-level shedding, both fixed in #305
The shedding change adds an explicit overload policy:
[php]
fpm_engine = "pool"
overload_policy = "shed"   # "wait" is the default and the old behavior
shed_after_ms = 0          # grace window before a queued request is shed
Shedding needs a queue to reject from, and that’s engine specific. With the pool engine, a request that can’t get into
the bounded backlog gets a 503 with Retry-After. No PHP has run. With spawn_blocking the only safe shed point is
the [php] workers semaphore. Once a closure reaches tokio’s blocking queue it can’t be withdrawn. So spawn_blocking
with workers = 0 (the default) can’t shed at all. Startup logs a warning instead of pretending the setting did
something. Shed 503s are counted in ephpm_php_shed_total{engine}.
The SIGABRT write-up in #305 is worth reading on its own. The DB session lived in a thread_local!. During the first
query, the Turso engine registered its own buffer cache thread-local after ours. TLS destructors run in reverse
registration order. So the engine’s cache was gone by the time our destructor dropped a session that touched it.
try_with on our side couldn’t help because the panicking access was the engine’s. The fix is to never run that drop
on a dying thread. The session gets parked in a process-wide list and drained at the end of the next request.
Then the important part. I re-ran the exact same flood against a binary with the fixes (main at 180d0ac, the code
that became v0.7.0). Each lane was gated on its startup log so a misapplied env var can’t produce a fake result.
Closed-loop capacity on that binary was 339.7 RPS, so 400/s was about 1.2x and 800/s about 2.4x.
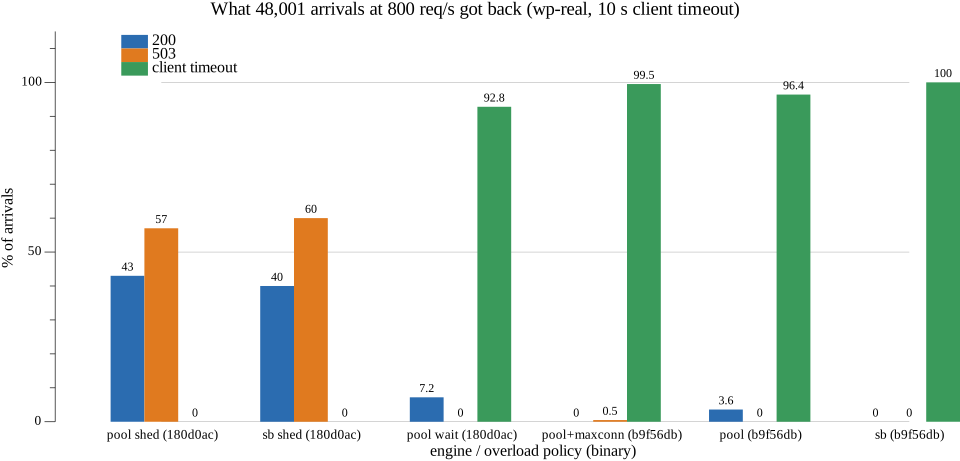
Data: b9f56db columns from SHEDDING.md,
180d0ac columns from shed-verify-v070.md. Single
run per point. “sb” is spawn_blocking; the sb shed lane runs with workers = 32 and shed_after_ms = 200.
On the shed lanes every one of the 48,001 arrivals got an answer. Each got a 200 or a 503, with zero client timeouts.
The 503s were fast, too. I measured them directly with timed side probes mid-flood at 600/s against a pool+shed
instance. The shed ones came back in p50 1.7 ms, max 9.8 ms. The successes stayed sane at p50 190 ms, p99 237 ms. The
wait lanes had p99s of 9.2-10 s, which is just the client timeout showing through. In-flight requests on the pool
shed lane never went above 76. The pool wait lane hit 7,780 at the same rate.
The per-second series shows why shedding is the right shape and not just a nicer error code:
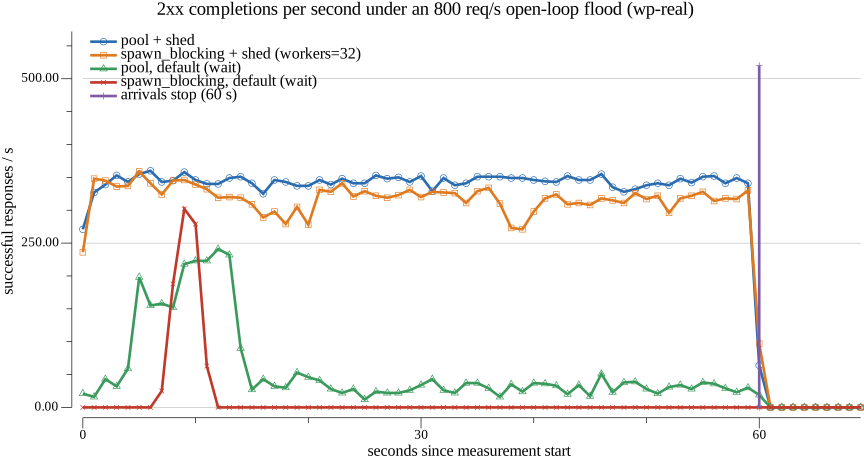
Per-second 2xx completions from the shed-verify raw JSON (binary 180d0ac, wp-real, 10 sites, 800 req/s).
The pool shed lanes deliver about 344 2xx/s for the whole minute. The spawn_blocking shed lanes deliver 320-336.
That’s the closed-loop capacity of the box. Overload no longer costs you the requests you could have served. The
default wait lanes do what you’d guess from the mechanism. There’s a burst while the queue is still young. Then the
queue fills with requests whose clients will time out before they’re served. Goodput falls to a trickle (pool) or to
zero (spawn_blocking). That spawn_blocking instance was still wedged 30 s later at 6.2 GB. At 400/s it now
recovers, which the original never did. But the default can still wedge under a deep flood. The remedy is
configuration (pool, or workers plus shed), and the preview preset applies it.
Across all 10 flood points, plus cooldowns and SIGTERM shutdowns, zero processes died.
What I’d tell you to check on your own server
- Run one open-loop test before you believe any overload claim. It doesn’t need to be fancy. Constant-rate
arrivals, a client timeout, and a breakdown of what came back. If you only have
wrk, you don’t know. - Classify the failures. A timeout and a 503 are not the same “error.” One means the server is still in control.
- Percentiles over successes only, and look at the per-second series, not just the aggregate.
- Check the generator kept its schedule. Record scheduling lag and max in-flight. If in-flight is far below
rate x timeout, the generator throttled itself and you’re looking at a closed-loop test with extra steps. - Fresh instance per point. Back-to-back points inherit tens of thousands of TIME_WAIT sockets from the previous one. Two reruns in the original session differed from their matrix twins by up to 8x on delivered goodput. That’s why both reports call their numbers shape, not SLA.
And the meta point. Our docs said max_connections returned 503s, and that was technically true. It just didn’t
protect anything. A claim like “we shed load” is something to measure. The test that measures it isn’t the one you
already have.
How I measured
- Host: AMD Ryzen 9 5950X (32 threads), WSL2 on Windows 11, 62 GiB. The original run predates the harness cwd fix described in the WSL post. Its server ran with a DrvFs working directory. The re-run was on native ext4. SHEDDING.md’s erratum argues that the shed/no-shed, wedge and crash findings don’t depend on it, and I agree. Its absolute delivered-RPS numbers read a little low.
- Workload: real WordPress core plus the db-wordpress drop-in, 10 sites, per-site Turso DBs,
max_open_dbs = 4096. - Load:
loadgen -rate {400,800} -arrival const -timeout 10, 5 s warmup, 60 s measured, then 30 s cooldown and a closed-loop probe (c=4, 10 s). - Binaries:
b9f56db(before) and180d0ac(after), bothcargo xtask release 8.5from source. - Harness:
scripts/run_overload.shin both repos. Raw JSON for the original run is underresults/wp-real-openloop/in multitenant-scalebench.
Links
- ephpm/multitenant-scalebench:
loadgen/main.go,report/SHEDDING.md(commitde3494a) - ephpm/lab
docs/shed-verify-v070.md, where the harness lives now underscale/ - ePHPm PRs: #296 (pool engine), #298 (preview preset, serve-after-503), #305 (TLS-destructor SIGABRT, load shedding)