My Benchmark Was 4x Wrong Because of WSL
Launching the server with its working directory on /mnt/c cost ePHPm about 4x on a light workload. The report built a wrong explanation on top of it, and the strace shows why.
I do most of my benchmarking on a Windows box in WSL2. It’s the machine on my desk with 32 threads and 62 GB of RAM.
Everybody who does that learns the first rule early: don’t put your data on /mnt/c. DrvFs is the 9p-backed mount that
exposes the Windows drives inside WSL, and it’s slow for file-heavy work. So the databases, the docroot and the build
output all live on the WSL ext4 disk. My scaling harness for ePHPm even says so in
capital letters in its README.
Then I published a multi-tenant scaling report with a headline number that was off by almost 4x. The cause was one file-system path I hadn’t thought of as data at all: the server’s working directory.
The wrong story
multitenant-scalebench measures one ePHPm instance serving N
WordPress-shaped sites. The light workload (wp-lite) plateaued at about 4.7k RPS with only about 5 of 32 cores busy.
That held no matter how many sites I served. Low CPU plus a flat ceiling looks like lock contention, and there was a
perfect suspect. The per-site database registry was a single tokio::sync::Mutex held across every database open. So
the report said the registry mutex capped every instance near 4.7k RPS regardless of core count. The sizing sheet
repeated it.
That story was plausible and it fit the data. It was also wrong.
How it fell apart
The fix for the mutex was ePHPm #303. It replaced the global map with per-site slots, each holding its own lock. If the mutex was the ceiling, #303 should have lifted it. Under the harness it didn’t. The warm point was about 4.0k RPS before and after. The churn case (more sites than the LRU cap) did improve, and a bistable collapse went away. But the warm ceiling sat exactly where it was.
So I started the server by hand from a shell in /root to poke at it. I got 15,900 RPS on the same point. Same
binary, same config, same provisioned databases. Back in the harness: 4,164 RPS. The only difference was where the
process was started from. The harness lived in the repo checkout on /mnt/c/Users/luther/multitenant-scalebench, and
it launched the server like this:
start_server() {
  : > "$LOG"
  "$BIN" serve --config "$CFG" >>"$LOG" 2>&1 &
  SRV_PID=$!
Everything the server read was on ext4. The docroot was staged to the native run dir. The per-site databases lived there and the config was rendered there. But the process inherited the shell’s working directory, and that was on DrvFs.
The fix (e92483e) is two lines of intent. Start
the server from the native run dir. Refuse to run at all if the run dir itself is on /mnt/*.
case "$RUN" in
  /mnt/*) echo "RUN=$RUN is on DrvFs (/mnt/*) — use a WSL-native path" >&2; exit 1 ;;
esac

start_server() {
  : > "$LOG"
  ( cd "$RUN" && exec "$BIN" serve --config "$CFG" ) >>"$LOG" 2>&1 &
  SRV_PID=$!
Why a working directory costs anything
I wanted to know why a directory the server never reads from could cost 4x, so I re-ran it under strace. The setup
matched the report: the v0.7.0 release binary, wp-lite, 50 sites. One instance started from ext4 and one from a DrvFs
directory. Each got a light 4-worker load for 3 seconds while strace -f recorded every syscall.
On the DrvFs run, every single request ends with this:
lstat("/mnt/c/Users/luther/AppData/Local/Temp/.../bench/drvfs-cwd", ...) = 0
lstat("/mnt/c/Users/luther/AppData/Local/Temp/.../bench", ...) = 0
...
lstat("/mnt/c/Users/luther/AppData", ...) = 0
lstat("/mnt/c/Users/luther", ...) = 0
lstat("/mnt/c/Users", ...) = 0
lstat("/mnt/c", ...) = 0
lstat("/mnt", ...) = 0
stat("/mnt/c/Users/luther/AppData/Local/Temp/.../bench/drvfs-cwd", ...) = 0
That’s one lstat per path component, walking from the leaf up to /, then a stat of the full path. It happened 759
times for 755 requests, so once per request. The same walk happens on the native run too. There it’s just /root and
one directory under it, on ext4, and it costs nothing.
That walk is PHP. php_execute_script in main/main.c saves the current directory and chdirs into the script’s
directory so relative includes work. It runs the script and then changes back:
if (primary_file->filename && !(SG(options) & SAPI_OPTION_NO_CHDIR)) {
	php_ignore_value(VCWD_GETCWD(old_cwd, OLD_CWD_SIZE-1));
	VCWD_CHDIR_FILE(ZSTR_VAL(primary_file->filename));
}
/* ... run the script ... */
if (old_cwd[0] != '\0') {
	php_ignore_value(VCWD_CHDIR(old_cwd));
}
ePHPm is a ZTS build because it runs PHP on many threads in one process. In a ZTS build VCWD_CHDIR goes through PHP’s
virtual CWD layer. That layer resolves the path component by component with lstat, leaf first. In this trace nothing
cached it, so the walk ran on every request. Each of those components below /mnt/c is a round trip over 9p to the
Windows host. SAPI_OPTION_NO_CHDIR is the escape hatch. It’s what php-cgi -C sets. But PHP apps expect the cwd to
be the script’s directory, so turning it off would be a behavior change, not a perf fix.
A handful of extra lstats per request shouldn’t cost 4x on its own. What makes it expensive is that DrvFs behaves
like a shared, serialized resource under concurrency. CPU on the DrvFs run dropped to about 2 cores. That’s the
signature of threads waiting rather than working. It’s exactly the signature I had blamed on the mutex.
It scales with the depth of the path
That suggested a test. If the cost is per path component on DrvFs, a deeper working directory should be slower. So I ran the same 50-site point from four working directories, interleaved, two runs each.
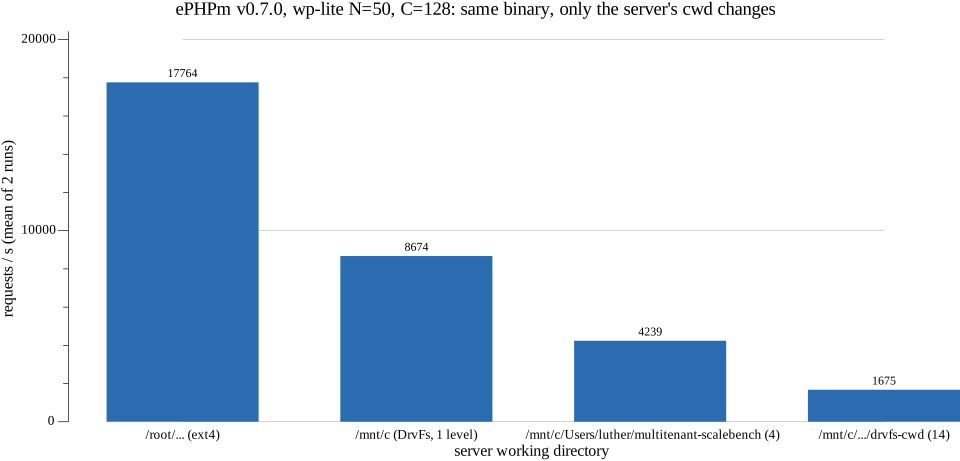
| server cwd | DrvFs ops per request | RPS (2 runs) | CPU cores | p50 |
|---|---|---|---|---|
/root/scratch-... (ext4) |
0 | 17,437 / 18,090 | 21.5-21.9 | 6.3-6.5 ms |
/mnt/c |
2 | 8,499 / 8,849 | 9.9-10.1 | 14.4-15.0 ms |
/mnt/c/Users/luther/multitenant-scalebench |
5 | 4,213 / 4,265 | 4.8 | 28.9-29.9 ms |
/mnt/c/Users/luther/AppData/.../drvfs-cwd |
15 | 1,662 / 1,689 | 2.2-2.3 | 75.9-76.7 ms |
“DrvFs ops per request” counts the lstats for path components at or below /mnt/c, plus the final stat. /mnt
itself isn’t DrvFs. Multiply it by RPS and the three DrvFs rows land in the same neighborhood. That’s about 17k, 21k
and 25k metadata operations per second. It looks like this box tops out somewhere around 20k DrvFs path lookups a
second across all threads. The server’s throughput becomes that number divided by how many lookups each request
costs. Throughput and CPU fell together, which is what “everybody’s waiting on the same thing” looks like.
The 4-level row is the path the original harness ran from. It lands at 4,239 RPS, right on top of the 4,164 from the #303 validation. The deep path is just my scratch directory for this re-run, and it’s 10x slower than native. An earlier session ran the same native-vs-deep comparison as three interleaved pairs. It gave 15.0-15.4k vs 1.41-1.48k RPS. The absolute numbers move with whatever else the box is doing, but the ratio held.
So “4x” was never a property of DrvFs. It was a property of how deep my checkout happened to be.
What it changed
Re-basing everything on the fixed harness (BEFORE-AFTER.md) moved some conclusions and left others alone:
- The warm ceiling wasn’t ~4.7k RPS at 5 cores. It was 14.9k RPS at 16.5 cores on the pre-#303 binary. On main with #297, #302 and #303 it was 18.9k at 22.8 cores. The “registry mutex caps every instance” claim was withdrawn from the report and the sizing sheet.
- The churn collapse was real. More active sites than
max_open_dbsstill cratered to ~1.4k RPS at ~2 cores on the fixed harness. That one really was the mutex, and #303 lifted it 2.3x. - Real WordPress barely moved. It’s CPU-bound at ~105 ms per request, so a fraction of a millisecond of
lstatwas lost in the noise. It went from 243-253 RPS tainted to 266-272 fixed, about 7%. The ~9.5 req/s per core sizing constant held. - The cwd bug never touched RSS, fd counts or correctness, since the sampler reads
/procdirectly. The re-base did replace one wp-real RSS anchor. That was a low-outlier run, unrelated to the cwd.
The original report keeps its tables with inline [ERRATUM: ...] annotations instead of being rewritten. I’d rather
leave the wrong numbers visible next to the right ones than pretend they never existed. The
ephpm/lab README now has a “Traps That Taint A Run” section with this as the first
entry.
The rules I took away
- The working directory is part of the environment under test. For a PHP server it’s on the hot path of every
request. Check
/proc/<pid>/cwd, not just where your data lives. - Make the harness refuse bad environments, don’t document them. A
case "$RUN" in /mnt/*)guard is worth more than a paragraph in a README. - Low CPU plus a flat ceiling doesn’t prove lock contention. It proves something is waiting. Before you name the thing, take the most obvious step. Change one variable at a time against the same binary.
- When a fix doesn’t move the number it should have moved, believe it. #303 not lifting the warm ceiling was the clue that the ceiling wasn’t the mutex.
How I measured
- Host: AMD Ryzen 9 5950X (16 cores / 32 threads), Windows 11, WSL2 kernel
6.18.33.2-microsoft-standard-WSL2, 62 GB available to WSL. - Binary: the ePHPm v0.7.0 release (
ephpm-v0.7.0+php8.5.7-linux-x86_64.tar.gz, sha256a79adefa...61fcee). - Workload: wp-lite from multitenant-scalebench, N=50 sites,
max_open_dbs = 4096. Per-site Turso DBs were re-copied from one seeded template before every run. Docroot and DBs were on ext4. Only the server’s cwd changed. - Load: the multitenant-scalebench loadgen, closed-loop,
-c 128, 5 s warmup, 15 s measured. Fresh instance per run, runs interleaved. - Trace:
strace -f -qq -p <pid>for ~5 s during a-c 4run. - The original 4,164 vs 15,900 RPS figures are from the #303 validation, quoted in the PR body and in commit
e92483e.
Links
- ephpm/multitenant-scalebench: commit
e92483e(the fix),8e7e854(the re-base),report/REPORT.mderratum - ePHPm #303, where the harness bug was found
- ephpm/lab README, “Traps That Taint A Run”