P99 From 280 ms to 58 ms by Making the Queue Fair
ePHPm had the best throughput in a Laravel runtime comparison and the worst tail of the fast group. The cause was a bounded channel that let new requests cut in line.
A third-party Laravel runtime comparison put ePHPm’s worker mode at the top on
throughput. It was about 19% ahead of FrankenPHP on /api/static. It was also at the bottom of the fast group on tail
latency, with a P99 of 157 ms against FrankenPHP’s 57 ms. Best throughput plus the fattest tail is a shape worth
chasing, because fast execution can’t produce it. Making requests faster lowers the mean and the tail. Only waiting
can pull them apart. Specifically, unfair waiting.
This follows the thread pool post. ePHPm has two pools: the persistent worker pool and the new per-request pool. Both put a bounded queue in front of their threads, and both had the same defect.
What a fair queue should look like
The benchmark was wrk with 100 connections against worker_count = 2. At about 2,230 req/s, Little’s law gives the
mean time in system for an ideal two-server FIFO queue: 100 / 2,230 ≈ 45 ms. A closed-loop FIFO system at deep
saturation is nearly deterministic. Every request waits behind the same ~96 others. So P50, P90 and P99 should all sit
close to that 45 ms. FrankenPHP’s numbers looked exactly like that, with P99 at 1.1x its own ideal. ePHPm’s P99 was
3.5x.
I reproduced it on my box with the official v0.8.7 release (PHP 8.4, worker mode, same wrk shape). Three rounds gave this:
| round | req/s | P50 | P75 | P90 | P99 |
|---|---|---|---|---|---|
| 1 | 2,339 | 47.5 ms | 79.6 ms | 131.1 ms | 275.9 ms |
| 2 | 2,331 | 46.5 ms | 80.6 ms | 132.9 ms | 275.5 ms |
| 3 | 2,321 | 47.0 ms | 81.0 ms | 134.4 ms | 285.1 ms |
P50 is right at the ideal. Then P75, P90 and P99 climb in steps of about 43 ms. Those steps turned out to be the whole story.
The lottery inside send().await
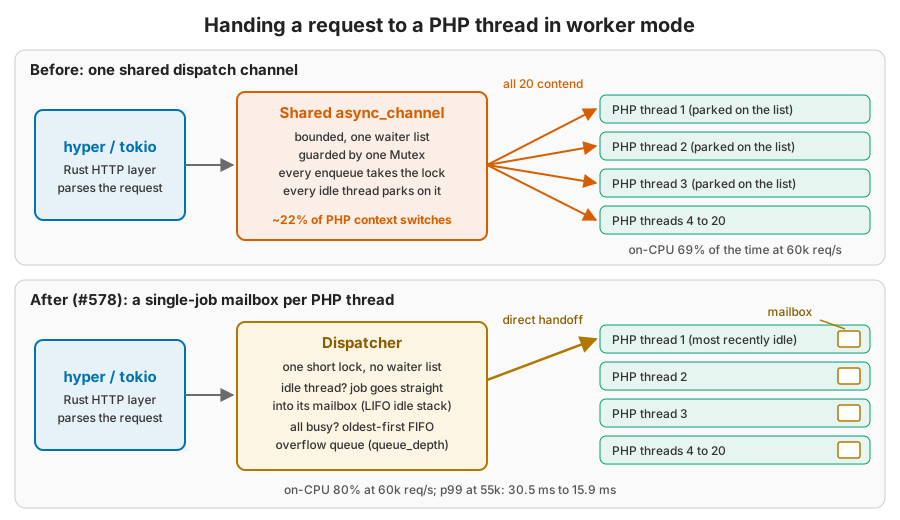
The worker pool’s dispatch queue was async_channel::bounded(worker_backlog). worker_backlog defaults to the worker
count. So the channel held 2 jobs and 2 more were executing. The other ~96 requests were parked inside the channel’s
Sender::send().await. In async-channel 2.5 that future is a try, listen, retry loop:
- On first poll it calls
try_sendbefore queueing behind the senders already parked. A request that just arrived can grab a freed slot ahead of waiters that have been parked for hundreds of milliseconds. That’s barging. - On
Fullit registers a listener at the back of the waiter list. - When a worker pops a job, exactly one waiter is woken. It has to get scheduled by tokio and then retry
try_send. If a barging sender got there first, the retry fails. The loser goes to the back of the line again, behind ~95 others.
Step 1 is why ePHPm topped the throughput chart. A freed slot never sits idle waiting for a parked task to get
scheduled. Step 3 is the tail. Each lost race costs one full lap of the waiter queue. At 2,230 req/s a lap of ~96
waiters is 96 / 2,230 ≈ 43 ms. One lost race lands you at about P75, two at P90, five or six at P99. The defect
turns scheduling jitter into whole multiples of 43 ms.
The tell-tale: requests that never waited
There’s a histogram for exactly the time a request spends inside dispatch().await. It’s
ephpm_worker_request_wait_seconds. Over a 70,083-request run:
| wait | cumulative |
|---|---|
| ≤ 1 ms | 42.7% |
| ≤ 25 ms | 47.7% |
| ≤ 50 ms | 66.1% |
| ≤ 100 ms | 86.1% |
| ≤ 250 ms | 98.8% |
| ≤ 500 ms | 99.9% |
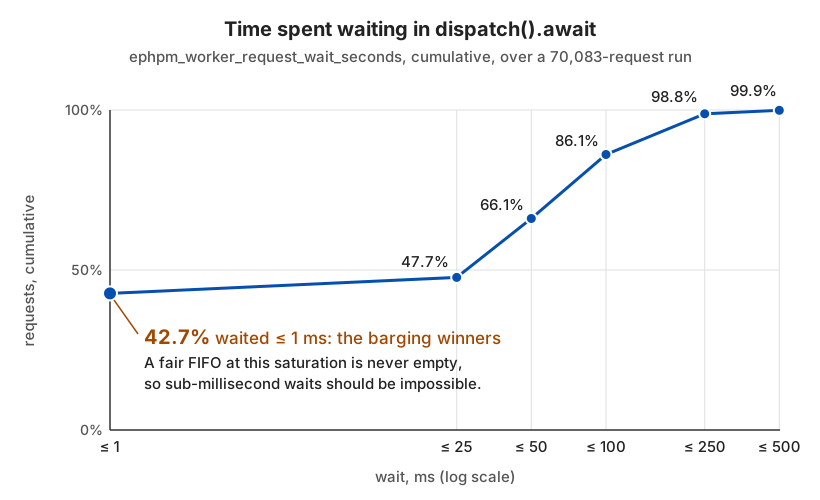
Mean wait was 41.2 ms against 1.6 ms of mean execution, so the wait is the latency. And 42.7% of requests got in under a millisecond. In a fair FIFO at this saturation the queue is never empty. Every request should wait about one lap, and sub-millisecond waits should be impossible. Those are the barging winners. The 13.9% that waited 2 to 12 laps are the same thing seen from the other end.
The histogram also ruled out the other suspects:
- No per-worker mailboxes. There’s one shared queue, so no head-of-line blocking across workers.
- No batching sawtooth.
- The response is a non-blocking
oneshot, so a slow client can’t hold a worker.
The fix: wait in a fair semaphore, not in the channel
tokio::sync::Semaphore is documented as fair. Permits go to waiters in the order they asked. A new acquirer queues
behind existing waiters even when a permit is free right now. Those are exactly the two properties send().await
lacks. So ephpm#443 moved the waiting out of the channel and into a
semaphore with one permit per queue slot:
pub async fn dispatch(
    &self,
    request: WorkerRequestOwned,
) -> Result<oneshot::Receiver<WorkerResponse>, DispatchClosed> {
    // Wait for a queue slot in strict arrival order. Errors only when
    // `drain()` closed the semaphore.
    let Ok(permit) = Arc::clone(&self.admission).acquire_owned().await else {
        return Err(DispatchClosed);
    };
    let (tx, rx) = oneshot::channel();
    let job = WorkerJob { request, respond_to: tx, admission: Some(permit) };
    // Holding a permit guarantees a free channel slot (capacity == permit
    // count, and every enqueued job holds one permit until a worker pulls
    // it), so this `try_send` cannot see `Full`.
    match self.dispatch_tx.try_send(job) {
        // ...
    }
}
The worker drops the permit the instant it pulls the job off the channel. That’s the same moment a slot freed up under the old scheme, so the refill pipeline and throughput don’t change. The freed slot just goes to the longest-waiting request instead of the luckiest one. A few details fell out of it:
drain()closes the semaphore along with the channel. Parked requests still wake up into the 503 path on shutdown.- A request cancelled by the outer timeout while parked leaves no trace, because tokio unlinks the waiter. That also
fixed a small existing leak. A request cancelled mid-
send().awaitused to leave the queue-depth gauge permanently high. - The shed path maps over one-to-one. A zero grace window is
try_acquire, and a non-zero one istimeout(grace, acquire). Shed-mode waiters queue fairly too. - A unit test,
admission_is_strictly_fifo_and_barge_proof, pins the invariant. Waiters are admitted in arrival order, and a newcomer can’t steal a freshly freed slot.
From the PR, same box, parent commit vs fix, four 30-second rounds each:
| req/s | P50 | P75 | P90 | P99 (per round) | max | |
|---|---|---|---|---|---|---|
| parent (barging) | 2,282 | 49.3 ms | 80.2 ms | 131 ms | 259 / 280 / 303 / 267 ms | 1.08 s |
| fix (FIFO) | 2,256 | 43.9 ms | 44.4 ms | 44.9 ms | 46 / 66 / 62 / 62 ms | 67 ms |
P99 went from about 280 ms to about 58 ms at -1.1% throughput. That’s inside the round-to-round spread. P99 landed at
1.3x the ideal sojourn, the same shape as FrankenPHP’s. P50 dropped too, because the median no longer carries lost
laps. The uncontended path didn’t move (-c1 P99 1.19 to 1.21 ms). After the fix, 98.5% of waits landed in the 25 to
50 ms bucket and none above 100 ms.
“But barging is more work-conserving”
That’s the objection, and it’s a reasonable instinct. If a slot can be filled by whoever is runnable right now,
surely you get more done. ephpm#458 added an escape hatch, [php] admission = "fifo" | "barge". It used that to settle the question on the per-request pool with a rotated A/B on the Laravel
bench. That was three rounds, with nginx+fpm as an in-session control:
| per-request pool, mean of 3 | health | static | cpu | db |
|---|---|---|---|---|
| req/s fifo / barge | 1030.8 / 1030.1 | 1018.9 / 1019.1 | 1008.8 / 1007.7 | 732.4 / 730.9 |
| P99 ms fifo / barge | 105.0 / 354.4 | 103.0 / 375.0 | 104.6 / 367.7 | 152.1 / 425.2 |
Identical throughput, three times the P99. Here’s why barging buys nothing. At saturation the queue is never empty, so FIFO hands each freed slot to a waiter that’s already parked. There’s no idle window. Both disciplines are equally work-conserving. Barging’s only theoretical edge is filling a slot during a wakeup gap. That’s microseconds against a service time measured in milliseconds.
Re-measuring it on a release binary
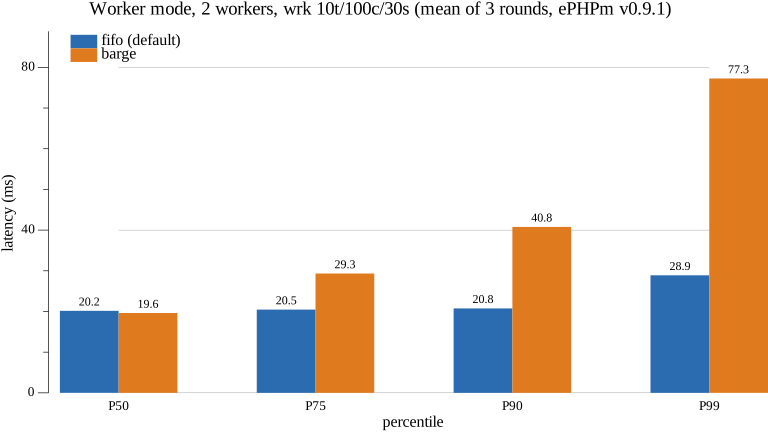
The knob means the A/B no longer needs two builds. So I re-ran the worker-mode comparison on the v0.9.1 release with
nothing but EPHPM_PHP__ADMISSION changing between runs. The worker is a tiny script that boots once and renders
about half a millisecond of PHP per request (400 rows, md5, usort, htmlspecialchars). It ran with concurrency = 2. wrk used 10 threads, 100 connections and 30 seconds, for three rounds alternating arms.
| mean of 3 rounds | req/s | P50 | P75 | P90 | P99 |
|---|---|---|---|---|---|
| fifo (default) | 4,917 | 20.2 ms | 20.5 ms | 20.8 ms | 28.9 ms |
| barge | 4,907 | 19.6 ms | 29.3 ms | 40.8 ms | 77.3 ms |
Same picture at a different service time. Throughput is a wash (0.2%), and so is the median. Everything above the
median spreads out under barging, while FIFO stays in a 1 ms band up to P90. Per round, barge’s P99 was 77.5, 76.5 and
77.9 ms. FIFO’s was 21.3, 32.5 and 32.9 ms. With one client (-c1) the two are identical: 551 µs and 550 µs at P50,
768 µs and 771 µs at P99. Fairness only costs or saves anything when there’s a queue.
Sidebar: which process actually answered?
Halfway through this investigation the A/B numbers stopped making sense. The fix seemed to work only with Prometheus
metrics enabled, then only on one port, then on neither. Every one of those phantom correlations had the same cause.
The A/B binaries were named ephpm-parent and ephpm-fix. The harness cleaned up with pkill -x ephpm, which
matches neither. A stale parent server held port 8000 for an hour. Meanwhile freshly started servers died on
Address already in use, and wrk kept measuring the stale process. Fat tail on 8000, tight tail on 8001, no matter
which binary the harness thought it was testing.
The rule I took from it: a benchmark number is only attributable to a server after you check which process served it.
Look up the listener’s PID, read /proc/<pid>/exe, and fail the run on a bind error instead of carrying on. My own
harness for this post does exactly that before every measured window.
How I measured
- Hardware: AMD Ryzen 9 5950X (16 cores, 32 threads), 62 GiB, WSL2 kernel 6.18.33.2-microsoft-standard-WSL2.
- Binary: the official
ephpm-v0.9.1+php8.4.23-linux-x86_64release, checksum verified againstSHA256SUMS. It ran in worker mode with[php] concurrency = 2and[php.worker] max_requests = 1000000, so no worker recycled mid-run. Each server was started fresh. Its startup log line confirmed the admission policy. The listening PID’s/proc/<pid>/exewas checked before every measured window. - Load:
wrk -t10 -c100 -d30s --latencywith a 3-second warmup per server. Three rounds alternated fifo and barge, thenwrk -t1 -c1 -d10sran per arm. Nothing else was benchmarking on the box during the window. - The PR tables above (#443, #458) are from the PR descriptions and the fairness doc. They were run on the same machine with a Laravel app.
Links
- ephpm#442 - the issue, from the Laravel runtime comparison
- ephpm#443 - FIFO-fair dispatch admission
- ephpm#458 - the
[php] admissionknob and the fifo vs barge A/B docs/architecture/worker-dispatch-fairness.md- the full write-up, including the measurement post-mortem- tokio
Semaphore(fairness is in the docs) and async-channel