Stop Running PHP on tokio's spawn_blocking - Own Your Thread Pool
Why ePHPm moved PHP execution off tokio's generic blocking pool onto threads it owns. How the switch rolled out behind a knob and what it did to memory, throughput and overload.
For most of its life, ePHPm ran every PHP request on tokio’s spawn_blocking
pool. It works. It passes tests and it serves benchmarks fine. It’s the first thing anybody reaches for when they need
to call blocking code from async Rust. It’s also quietly wrong for a language runtime. The problems only show up under
overload or after a crash. Over the last three weeks it got replaced with a pool of OS threads that ePHPm owns. That
pool shipped first behind a config flag, then as the default. As of v0.9.0 the spawn_blocking engine is gone.
One thing up front, because it’s the first question I get. This is not “drop tokio”. hyper, TLS, the database
wire protocols, gossip and every timer still run on tokio. That’s 95% of what tokio does for us. spawn_blocking is
tokio’s most generic component, and it’s the only thing that got replaced.
Why spawn_blocking is the wrong home for PHP
spawn_blocking is a convenience: “run this sync closure somewhere that isn’t the reactor”. tokio grows the pool on
demand up to a ceiling of 512 threads. It reaps threads that sit idle. It shares the pool with everything else that
blocks, including static file I/O. For PHP that causes three problems.
You can’t retire a poisoned thread. This is what forced the change. After a contained crash, the segfault containment work needed to abandon the thread with the corrupt Zend context and start a fresh one. tokio owns its blocking threads and recycles them on its own schedule. There’s no “kill this one” API. The containment spike proved the mechanism worked, and the PID survived 220 induced crashes. But a tenant sharing the box saw only 13.7% of its requests succeed during a crash storm, because the poisoned threads couldn’t be replaced. More on that in its own post.
Concurrency is unbounded, so memory is a function of traffic. Every in-flight request gets a blocking thread. Every PHP thread carries its own ZTS context. 512 concurrent requests means roughly 512 PHP contexts. On Kubernetes that’s the OOM-kill-under-flood failure mode. The pod’s memory ceiling is set by how hard you get hit, not by anything you configured.
Two halves of the config disagreed. ePHPm’s memory autotune divides a memory budget by N workers to pick
memory_limit. The runtime then happily ran many times N requests at once, since tokio’s blocking pool goes to 512
threads. The sizing logic and the execution engine made different assumptions and nothing reconciled them.
Parity by construction
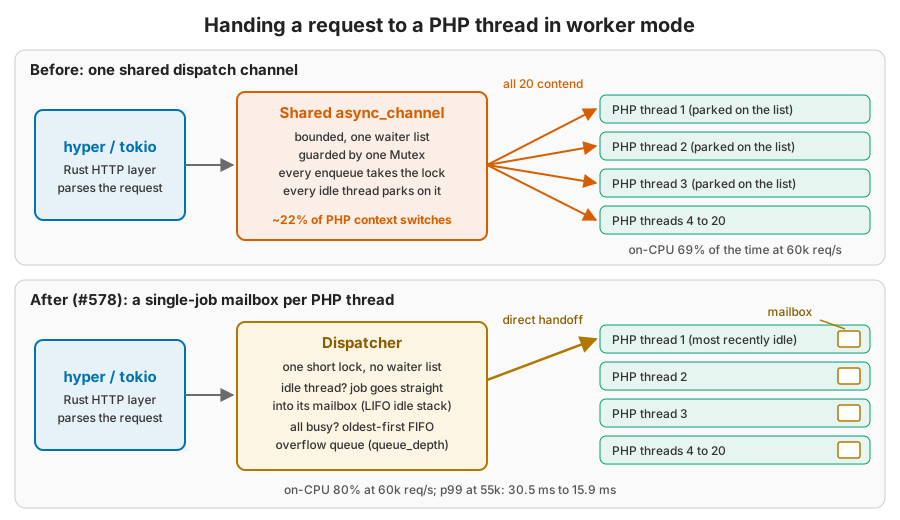
The new engine is a fixed pool of std::threads. Each registers with TSRM once, then loops pulling jobs off a
bounded async_channel and answering on a oneshot. Pool size is the concurrency cap. The part I’d recommend to
anyone doing a swap like this is how the two engines were wired. The per-request body was factored into one
closure. That covers the per-site DB session, KV keyspace, open_basedir and temp-dir INI, OPcache invalidation and
the bailout guard. The engines differ only in which thread runs it. This is the dispatch from the router while both
engines existed:
} else {
    // Cap concurrent PHP executions when [php].workers is set.
    // Once the closure reaches spawn_blocking it is committed to tokio's
    // unbounded, uncancellable blocking queue, where ePHPm can neither
    // reject nor withdraw it.
    let _php_permit = match &self.php_semaphore { /* ... */ };
    (tokio::task::spawn_blocking(run_php).await, None)
};
and the pool arm:
} = if let Some(pool) = self.fpm_pool.clone() {
    let recv = match self.overload_policy {
        OverloadPolicy::Wait => pool.dispatch(Box::new(run_php)).await.map_err(ShedReason::from),
        OverloadPolicy::Shed => pool
            .try_dispatch(Box::new(run_php), self.shed_after)
            .await
            .map_err(ShedReason::from),
    };
Same run_php, different thread. That made the code review tractable. It also made the benchmark a true
single-variable comparison.
The rollout: a knob, then data, then a default
Nothing about this was a big-bang migration:
- Opt-in (ephpm#296, August 15th).
[php] fpm_engine = "pool", default unchanged. It’s a real enum, so a typo is a startup error. It’s also env-overridable (EPHPM_PHP__FPM_ENGINE=pool). The benchmark lab could flip engines on the same binary with no code changes. - Benchmark in the lab, closed-loop and open-loop, and fix what the benchmarks found.
- Make it the default (ephpm#460, September 2nd). The PR left
spawn_blockingin as an opt-out, but it never shipped that way. #462 removed it the same night, before v0.9.0 was tagged. - Delete the old engine (ephpm#462, v0.9.0) and rename the
concurrency config to match what exists now. That’s
[php] concurrencyandqueue_depth, notworkers,worker_countandworker_backlog.
What the lab measured
The first head-to-head came from the multitenant-scalebench repo. It used the same binary with only the env var changed, on a 32-core WSL2 box with the pool sized to 32. Those runs were later found to have a harness bug that capped the light workload about 4x low. That’s its own post. From those runs I only trust the relative engine comparison and the memory numbers. Real WordPress is CPU-bound and wasn’t affected by the harness bug:
| real WordPress, 50 sites, c=128 | spawn_blocking | pool |
|---|---|---|
| RPS | 262.5 | 276.5 |
| p99 | 2,036 ms | 1,147 ms |
| RSS steady | 2,702 MB | 581 MB |
Better on both axes. With the CPU already saturated, 128 blocking threads just add scheduling contention. 32 pool threads, one per core, run cleaner. The re-run on the fixed harness (BEFORE-AFTER.md) landed in the same place: +7% RPS, p99 -22%, RSS -82% (574 MB vs 3.2 GB).
The honest tradeoff showed up on the light path. When there are more clients than pool threads, the extras queue and
the tail stretches. p99 went from 28 ms to 70 ms on a light endpoint at c=128. spawn_blocking buys a tight, uniform
tail by running everything at once. It pays for that in RAM.
Measuring it again myself
v0.8.9 was the last release with both engines in it. I re-ran the closed-loop comparison on it before the old engine
disappeared. The workload is one PHP page that does about 10 ms of CPU work. It builds 4,000 rows, runs usort,
renders 1,500 list items and runs hash() on the result. There’s no database, so it’s purely about how the two
engines schedule PHP. Every run used the same binary. The only difference is EPHPM_PHP__FPM_ENGINE. The pool
autotuned to 32 threads.
| clients | engine | RPS | p50 | p99 | max | steady RSS |
|---|---|---|---|---|---|---|
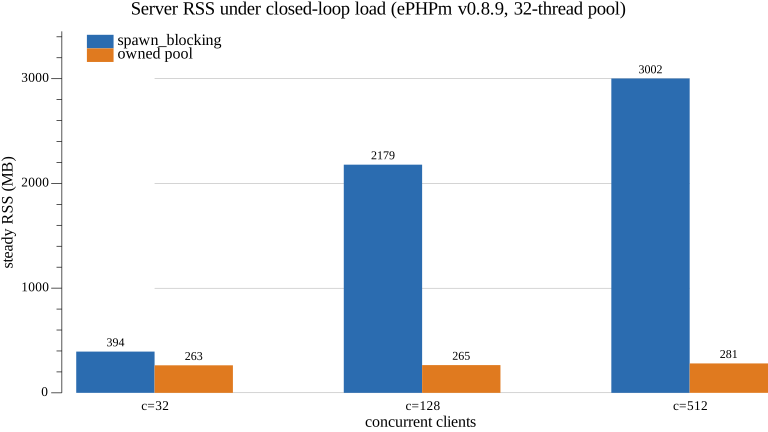
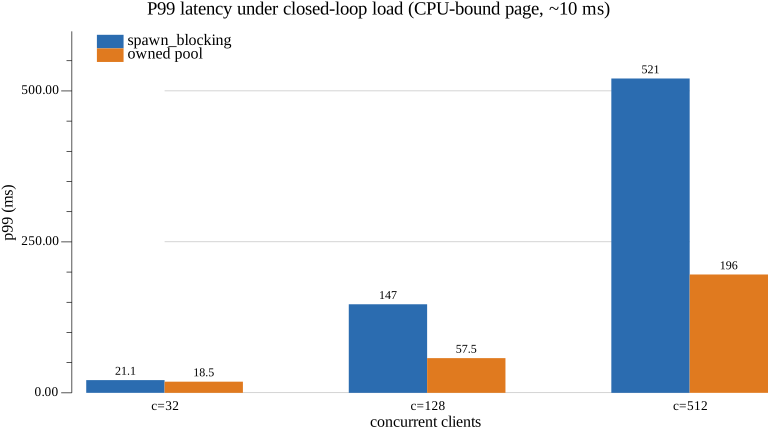
| 32 | spawn_blocking | 2,615 | 11.6 ms | 21.1 ms | 34 ms | 394 MB |
| 32 | pool | 2,737 | 11.3 ms | 18.5 ms | 28 ms | 263 MB |
| 128 | spawn_blocking | 2,508 | 43.9 ms | 146.7 ms | 347 ms | 2,179 MB |
| 128 | pool | 2,963 | 42.7 ms | 57.5 ms | 109 ms | 265 MB |
| 512 | spawn_blocking | 2,555 | 183.1 ms | 520.6 ms | 864 ms | 3,002 MB |
| 512 | pool | 2,981 | 170.4 ms | 196.0 ms | 236 ms | 281 MB |
The memory line is the headline. spawn_blocking grows with the number of clients because it holds one PHP context
per in-flight request. The pool stays flat at whatever 32 threads cost. On this CPU-bound page the pool also wins on
throughput (+18% at c=128) and on the tail. That’s the same shape as the real WordPress result above. Only when the
work is very light does spawn_blocking’s run-everything-at-once approach get its tighter tail back.
Open-loop is where it stops being close
Closed-loop benchmarks can’t show you overload. Every client waits for its response before sending another. An
overloaded server just makes the clients slower and reports zero errors. In open-loop runs, requests arrive at a fixed
rate whether or not earlier ones finished. Those runs are written up in detail in
What an Overloaded PHP Server Actually Returns. Here’s
the short version for real WordPress at 1.5x capacity. spawn_blocking delivered a burst, then went to zero goodput
and never recovered. RSS climbed to 5-6 GB. Its queue is unbounded and uncancellable. Requests whose clients had
already given up still ran, ahead of every new arrival. The pool stayed around 0.6 GB and recovered within 30 seconds.
It drops a queued-but-unstarted job when its client disconnects.
I ran my own version of that against the same 10 ms page on v0.8.9. The flood was 4,444 requests per second for 40 seconds, which is 1.5x the pool’s measured capacity. Clients had a 10-second timeout. After the flood came a 20-second cooldown and a light probe. There were three arms:
spawn_blockingwith the defaultwaitpolicy- the pool with
wait - the pool with
overload_policy = "shed"from #305
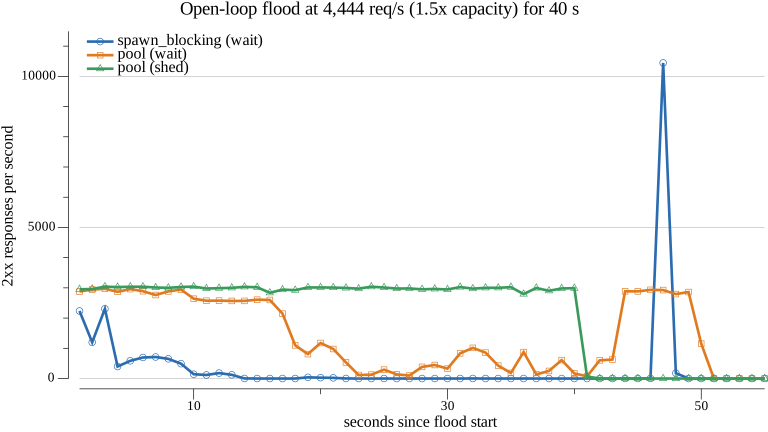
| arm | delivered 2xx/s | what the other arrivals got | p99 of successes | peak RSS |
|---|---|---|---|---|
| spawn_blocking, wait | 514 | 82,184 client timeouts, 75,021 connection errors | 9.7 s | 4,386 MB |
| pool, wait | 1,950 | 63,694 client timeouts, 36,060 connection errors | 10.7 s | 1,276 MB |
| pool, shed | 2,987 | 58,261 fast 503s, nothing else | 33.8 ms | 265 MB |
spawn_blocking went to zero goodput about 13 seconds in and stayed there until the flood stopped. The pool with
wait held capacity for about 15 seconds and then degraded too. Tens of thousands of connections waiting on a queue
is its own problem. The shed arm is the one that behaves like a server should. It served right at capacity the whole
time and answered everything else with an instant 503. RSS didn’t move.
Two honest caveats. First, the load generator itself was strained on the two wait arms. It had up to 38,000
requests in flight and up to 1.7 s of scheduling lag. The connection errors are client-side too. Read the middle of
those two curves as shape, not as precise numbers. Second, unlike the WordPress lab, all three arms recovered once the
flood stopped. The spike at 47 seconds is spawn_blocking’s backlog draining all at once. With a 10 ms page the stale
queue is seconds of work. With WordPress at 100 to 500 ms a request, it was minutes to hours.
The flood also flushed out three real bugs. That’s a decent argument for open-loop testing all by itself:
- The connection limiter wrote a 503 and then served the rejected connection anyway (#299).
- A thread-local destructor panic took down the whole process when a PHP thread retired (#300).
- There was no request-level shedding at all (#301).
Shedding turned out to be engine-specific too. With the pool, a request that can’t get into the bounded queue gets a
503 and no PHP has run. With spawn_blocking, once the closure is handed over there is nothing to reject from.
The numbers that made it the default
The default flip in #460 was decided on a Laravel benchmark. It ran wrk with 10 threads and 100 connections for 30 seconds, three rounds. One binary had the engine flipped by env. nginx+php-fpm ran as an in-session control.
| rps, mean of 3 | health | static | cpu | db |
|---|---|---|---|---|
| pool | 1029.0 | 1010.5 | 999.8 | 724.3 |
| spawn_blocking | 928.8 | 911.3 | 904.8 | 670.5 |
The pool’s worst round beat spawn_blocking’s best round in all 12 endpoint cells. Latency was lower at every
percentile. Under a 200-connection overload at default settings, spawn_blocking sat at 486 threads and 1,056 MB.
The pool sat at 65 threads and 193 MB, serving more.
What I’d tell someone else embedding a runtime
“Own your threads” cost nothing in dispatch overhead. That fear is what kept us on spawn_blocking for months. A
bounded channel and a oneshot per request is noise next to a PHP request. What you get for it:
- a thread you can retire
- a concurrency cap that’s the same number your memory sizing uses
- a queue you can cancel from or reject from
One thing the owned pool did not fix by itself was fairness. The bounded channel turned out to let new requests cut in line. That’s the next thing I’ll write up.
How I measured
- Hardware: AMD Ryzen 9 5950X (16 cores, 32 threads), 62 GiB, WSL2 kernel 6.18.33.2-microsoft-standard-WSL2.
- Binary: the official
ephpm-v0.8.9+php8.5.7-linux-x86_64release, checksum verified against the release’sSHA256SUMS. PHP 8.5.7 ZTS,[php] mode = "fpm", single site, everything else default. - Load: the Go load generator from multitenant-scalebench (
-cfor closed-loop,-ratefor open-loop). Each closed-loop point had a 5 s warmup and 20 s measured, with a fresh server per point. RSS and CPU were sampled from/procat 1 Hz. The server was started from a WSL-native directory. Before each run the harness checked that the listening PID’s/proc/<pid>/exewas the binary under test. - Single run per point on a dev box, so treat differences of a few percent as noise. Scripts and raw JSON are kept with my notes for this post.
Links
- ephpm#296 - opt-in dedicated FPM execution pool
- ephpm#298 / ephpm#305 - the serve-after-503 fix, the TLS destructor abort, request-level shedding
- ephpm#460 - pool becomes the default
- ephpm#462 - remove the
spawn_blockingengine, rename the concurrency config - multitenant-scalebench reports - ENGINE-COMPARISON, SHEDDING, BEFORE-AFTER
- tokio
spawn_blockingdocs