Clustered SQLite in ePHPm, Part 3: CDC Over the Cluster Channel
ePHPm ships Turso's change data capture stream between nodes over one authenticated, multiplexed TCP connection. This covers how that works and the two failover bugs that showed up when the e2e suite killed the primary.
By the end of Part 2 ePHPm v0.7.0 ran exactly one SQLite engine in process. That was Turso, for single-node and clustered mode alike. The sidecar was gone. What I skipped over is how a replica actually gets the primary’s writes, and what happens when the primary dies with data on it. That’s this post.
- Part 1: Replication by sidecar with sqld
- Part 2: Adding Turso
- Part 3: CDC over the cluster channel (this post)
CDC from the engine itself
Turso has change data capture built in. Turn it on for a connection and every committed change lands in a turso_cdc
table. Each row has a monotonically increasing change_id, the table, the rowid, and before/after images of the record.
The primary tails that table and ships transaction batches. Replicas apply them. That’s the whole design. It landed as
an experimental path in #186 at the end of July. The tailer and applier live
in litewire (litewire#10).
The best surprise of the whole series came out of the first integration test: Turso’s CDC captures DDL.
CREATE TABLE, CREATE INDEX, ALTER TABLE ... ADD COLUMN and DROP TABLE all show up in the same turso_cdc
stream as the row changes. They appear as mutations on sqlite_schema. The after-image’s sql column carries the
CREATE text, so the replica just runs it. That means replication is one ordered stream. There’s no separate schema
sync channel to keep in step with it. WordPress creates and alters tables at runtime (plugins do it all the time) and
that flows through the normal path.
That convenience is also an injection point, since the replica runs SQL text a peer sent it. Replayed DDL is parsed and
allowlisted before it runs (litewire#17, in v0.6.2). It has to be exactly one CREATE TABLE, CREATE [UNIQUE] INDEX,
CREATE VIEW or CREATE TRIGGER. That’s everything sqlite_schema.sql can legitimately hold. ATTACH and PRAGMA
don’t get through.
The primary side of the stream is a loop per subscriber. Each replica gets its own CdcTailer starting at the watermark
the replica announced:
let mut tailer = CdcTailer::new(mgmt, from);

loop {
    let batch = match tailer.poll_batch().await {
        Ok(batch) => batch,
        Err(e) => {
            // Drop the stream rather than skip past the failure --
            // the replica reconnects with the same watermark and we
            // retry from the identical cursor.
            cdc_metrics::record_tail_poll_error();
            anyhow::bail!("CDC tail poll error: {e:#}");
        }
    };
    // ...
    match shippable {
        Some((batch, commit_change_id)) => {
            let frame =
                Frame::Batch { rows: batch.rows.iter().map(WireCdcRow::from).collect() };
            write_frame(&mut stream, &frame).await?;
            subscriber.record_batch_shipped(commit_change_id, rows);
        }
        None => {
            if idle_since.elapsed() >= HEARTBEAT_INTERVAL {
                write_frame(&mut stream, &Frame::Ping).await?;
            }
            tokio::time::sleep(POLL_INTERVAL).await;
        }
    }
}
Turso has no wakeup signal for CDC inserts, so it polls. POLL_INTERVAL is 25 ms. Keep that number in mind for the
benchmark below.
v1 was a third protocol
The first version of #186 had its own port (cdc_listen, 5015), length-prefixed JSON frames, and no encryption. It
worked. It was also the third separate inter-node protocol after gossip and the KV data plane. I was going to need
snapshot bootstrap next, and probably more after that. Each one wasn’t going to get its own port. So before #186
merged, the transport became the cluster channel. cdc_listen was deleted before it ever shipped in a release
(#219).
The rule the channel makes explicit is: gossip carries names, the channel carries payloads.
- Gossip (chitchat, UDP 7946) is the control plane only. Membership, phi-accrual failure detection, elections, small KV values. It has to stay small no matter how many writes you do.
- The cluster channel (TCP 7948) is the data plane for logs: CDC batches and snapshot bootstrap.
Gossip says “node A is primary for sqlite:default”. The channel is what moves the transactions from A to its replicas.
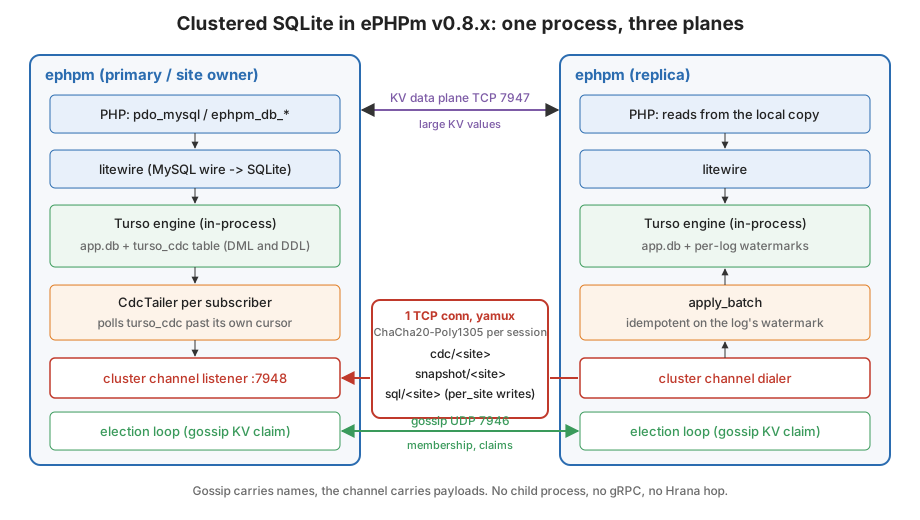
Why 7948 and not 7947? Because the KV data plane already took gossip + 1:
// gossip_port + 2, NOT + 1: the KV data plane's default port (7947) is
// already gossip-default (7946) + 1, so deriving +1 would collide with
// it on any default-ported cluster. +2 lands on 7948 with defaults.
let port = gossip
    .port()
    .checked_add(2)
    .context("gossip port is >= u16::MAX - 1; cannot derive cluster channel port")?;
Only bound when something asks
A config that doesn’t use a channel feature gets no socket, no task, and no log line above debug!. The only way to
turn it on is a field in one struct:
#[derive(Debug, Clone, Copy, Default)]
pub struct FeatureFlags {
    /// Turso CDC replication.
    pub cdc: bool,
}

impl FeatureFlags {
    #[must_use]
    pub fn any_enabled(&self) -> bool {
        let Self { cdc } = *self;
        cdc
    }
}
The destructuring in any_enabled is on purpose. Add a field and that line stops compiling until you decide whether the
new feature needs the channel. A feature that forgets its flag gets no channel, rather than a half-wired one. There’s a
unit test that runs with every flag off. It then binds the derived port itself to prove nothing else did.
One connection, many streams
After the handshake (next section) both sides speak yamux over the encrypted
socket. Every stream starts with a length-prefixed type string, and that string is the dispatch key. The types are
cdc/<site>, snapshot/<site>, and later sql/<site>. An unknown type gets a WARN and the stream is closed. The
connection stays up. New features can ship without a protocol version bump, because old nodes just refuse the stream
they don’t know.
Backpressure was the part I worried about. yamux has per-stream flow control (256 KiB window). Every subscriber owns a
private CdcTailer, so a stalled replica pauses its own stream and nothing else. The tailer just stops advancing while
its write is blocked. An earlier design broadcast one shared cursor to everyone. There a slow subscriber got
RecvError::Lagged and permanently lost batches. Now the failure mode for a slow replica is lag, not loss.
Snapshot bootstrap rides the same connection. An empty replica pulls a logical dump on snapshot/<site>, captured
under one read view along with its watermark. The dump is validated against a CREATE/INSERT allowlist. Then the
replica subscribes to the tail from exactly that watermark.
The handshake
The first channel handshake was one round trip. The initiator sent a sealed challenge, and the responder opened it and echoed it back. That proves the responder has the secret. It does not prove anything about the initiator. The responder only ever echoes what it’s handed. So anyone who recorded one legitimate setup could replay those bytes verbatim and get through the accept path without the secret.
v2 is a mutual challenge/response, three messages before any yamux frame:
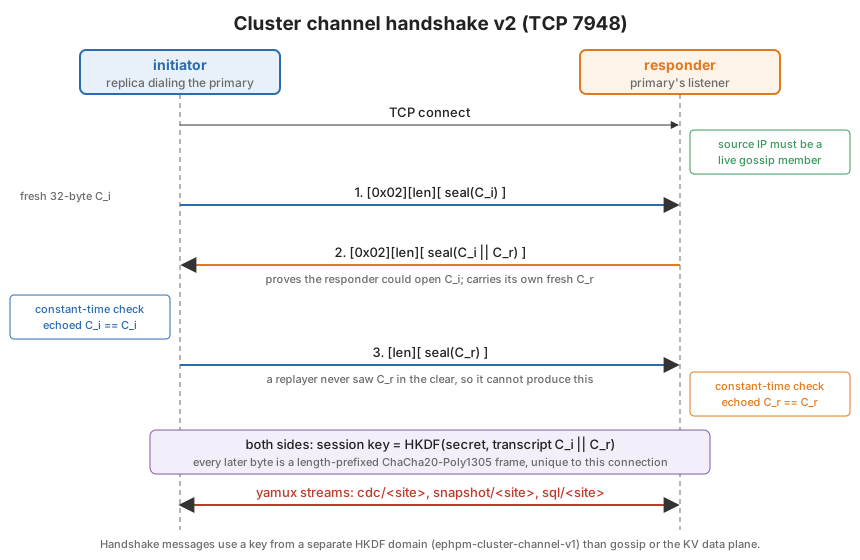
The important line is in the responder. It mixes in a challenge of its own, which a replayer has never seen and can’t open:
let challenge_r = fresh_challenge();
let session_transcript = transcript(&challenge_i, &challenge_r);

// Message 2 seals the transcript itself: the echo of C_i (which
// proves we opened it) followed by our own fresh C_r.
tcp.write_all(&[HANDSHAKE_VERSION]).await?;
let sealed = keys.handshake.seal(&session_transcript).context("seal handshake reply")?;
write_handshake_body(tcp, &sealed).await?;

// Message 3 must be the responder challenge, sealed by a peer that
// holds the secret. A replayer cannot get here.
let confirm =
    read_handshake_body(tcp, &keys.handshake).await.context("read handshake confirmation")?;
anyhow::ensure!(
    constant_time_eq(&confirm, &challenge_r),
    "handshake confirmation did not echo our challenge (replay attempt)"
);

Ok(keys.session(&session_transcript))
The rest of it:
- Both echo comparisons are constant time.
- The handshake key comes from its own HKDF domain, so a stray gossip datagram or KV frame can never authenticate here.
- After the handshake, both sides derive a per-connection session key from the secret salted with
C_i || C_r. Every byte yamux writes goes out as a length-prefixed ChaCha20-Poly1305 frame. Frames can’t be spliced between connections, and a frame that fails authentication drops the connection. - The source IP has to be a live gossip member before the handshake even starts. That’s coarse. It’s per host, and it trusts the TCP source address. But it means a leaked secret alone doesn’t let an arbitrary host pull a database snapshot.
- At most 64 concurrent handshakes in flight, a 10 second deadline on each.
- It refuses to bind at all if a channel feature is on and there’s no secret. Authenticated or absent.
There’s a test that does exactly what the v1 attack did. It records a real initiator’s first message and replays it on a new connection. It echoes back whatever the responder says. Then it asserts nothing ever reaches the dispatch table.
Then the e2e suite killed the primary
Everything above passed its tests. The two-node path had been validated by hand during benchmarking. What hadn’t
happened was a test that started three real ephpm processes, wrote data, and killed the elected primary.
#310 added that suite, and it found two defects on its first run. Both were
filed as #[ignore]d tests carrying the log evidence. That way the intended behavior was written down and executable
before anyone touched the fix.
1. A joining node stole the primary role.
21:41:58  cdc-node-2  elected as SQLite primary          (holds the data)
21:42:04  cdc-node-3  elected as SQLite primary          (empty, just booted)
21:42:08  cdc-node-2  role changed Primary -> Replica{ primary: node-3 }
The initial role was decided before gossip converged. A freshly booted node saw a member list containing only itself. It concluded it was the lowest-ordinal alive node and published a claim. Gossip KV is last-write-wins, so the incumbent demoted. The cluster re-rooted onto an empty database. The joiner believed it was primary, so it never bootstrapped.
2. Writes after a failover were silently never replicated.
cdc-node-1  CDC replica: subscribed  from_change_id=5   (watermark from the dead node-2)
cdc-node-0  CDC: subscriber attached from_change_id=5   (tailer over node-0's own log)
change_id is a per-database sequence. The subscribe watermark was being treated as cluster-wide. A promoted replica’s
own CDC log starts empty, because applied batches bypass capture. Its first new writes landed at change_id 1 and 2.
That’s below the inherited cursor of 5, so the tailer never yielded them. No error, no metric moved, and the replica
reported itself connected and caught up. That’s unbounded silent write loss after any failover.
The fixes are in #346:
- Election: a fresh node can’t publish its first claim until a 15 second startup grace has passed. That’s the claim TTL plus one heartbeat. A live incumbent republishes every 5 seconds, so its claim always arrives first. A restarting incumbent whose own claim is still unexpired can reclaim right away. A primary that sees a live foreign claim breaks the tie by lowest node id, the documented rule, instead of yielding to whoever wrote last. The cost is that a brand new cluster elects its first primary 15-20 seconds after boot.
- Watermarks: every database file gets a random 128-bit log identity. The first frame on every CDC stream is now a
Hellonaming the log the primary is about to serve. The replica keeps a cursor per log:
enum Frame {
    /// Primary -> replica, first frame on every stream. Identifies
    /// which CDC log the primary is about to serve.
    Hello { log_id: String },
    /// Replica -> primary, sent after Hello. The applied watermark
    /// in the log the Hello named.
    Subscribe { from_change_id: i64 },
    Batch { rows: Vec<WireCdcRow> },
    Ping,
}
On a source switch the replica does three things:
- Saves the old log’s cursor.
- Restores the new log’s cursor (0 if it has never followed it).
- Re-seeds litewire’s watermark table so the applier’s idempotency guard follows along.
Primary to replica to primary again resolves correctly.
Removing the #[ignore] was the verification step. Then each fix was verified the other direction. I reverted just that
fix, kept the other, and watched its test fail again with the original symptom. The joining-node test failed with the
joiner taking the role. The failover test failed with the survivor stuck at its pre-failover rows until a 90 second
timeout. Then both went back in. The full e2e run was 55 suites, 236 tests, zero failures. Proving a test fails without
the fix is the only way I know to be sure it’s testing the fix.
The audit of #346 turned up one more, narrower door (#353). The fast-restart
reclaim matched on node id. But “same node id” isn’t “same data”. A node redeployed onto an empty volume comes back with
its old id and a fresh log identity. It could win the reclaim inside the 10 second TTL and re-root the cluster onto
nothing again. The claim is now node_id|addr|log_id, and the fast path only fires when both match.
Worth saying plainly: none of these bugs were Turso’s. All three lived in ePHPm’s election and watermark logic layered on top. Turso’s CDC stream did exactly what it said the whole time. One ordered stream, monotonic ids, and DDL included. If you’re wondering whether to trust the beta engine, under failover testing the beta wasn’t what broke.
How far behind is a replica?
ePHPm doesn’t export a replication lag gauge yet, so I measured it from the outside. I ran two v0.8.7 nodes on one
machine with the real cluster channel between them. The primary was on 127.0.0.1 and the replica on 127.0.0.2. A
small Go probe inserts a row through PHP on the primary. It takes the time when the HTTP response comes back, since the
write is committed at that point. Then it polls a PHP page on the replica every ~2.4 ms until the row shows up. I took
150 samples per step, with a random pause between samples so they don’t line up with the tailer’s 25 ms poll. In the
background, a separate open-loop writer puts a steady rate of single-row INSERTs on the primary.
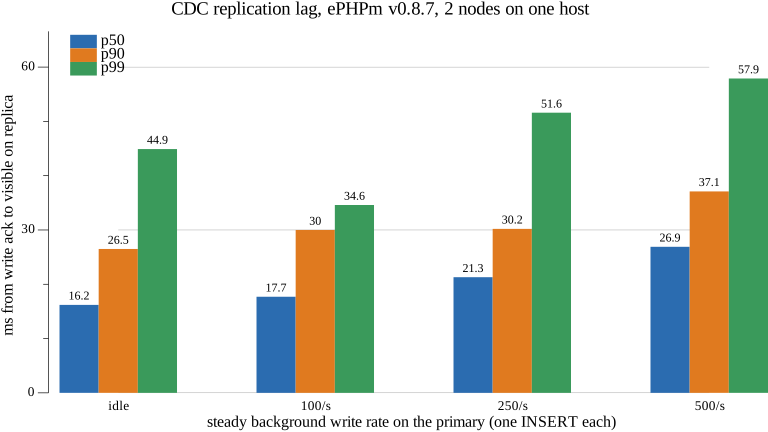
| background writes | p50 | p90 | p99 |
|---|---|---|---|
| idle | 16.2 ms | 26.5 ms | 44.9 ms |
| 100/s | 17.7 ms | 30.0 ms | 34.6 ms |
| 250/s | 21.3 ms | 30.2 ms | 51.6 ms |
| 500/s | 26.9 ms | 37.1 ms | 57.9 ms |
That’s what a 25 ms poll looks like. On an idle primary the median is a bit over half the interval plus the apply. It creeps up as the stream gets busier. For a PHP app, a replica that’s 20-30 ms behind is fine.
At 1,000 writes/s it stopped being fine. The replica fell behind and kept falling. Five probes in a row timed out at 5 seconds, and the ten that did land had a median of 1.7 seconds. So I went looking for the ceiling. I hit the primary with closed-loop writers for 17 seconds and didn’t touch the replica. Then I timed how long it took to catch up:
| burst | primary inserts/s | single node inserts/s | replica drain rate |
|---|---|---|---|
| 1 writer | 2,288 | 2,740 | 757 rows/s (25,161 rows in 33.2 s) |
| 4 writers | 5,154 | 6,372 | 810 rows/s (76,383 rows in 94.3 s) |
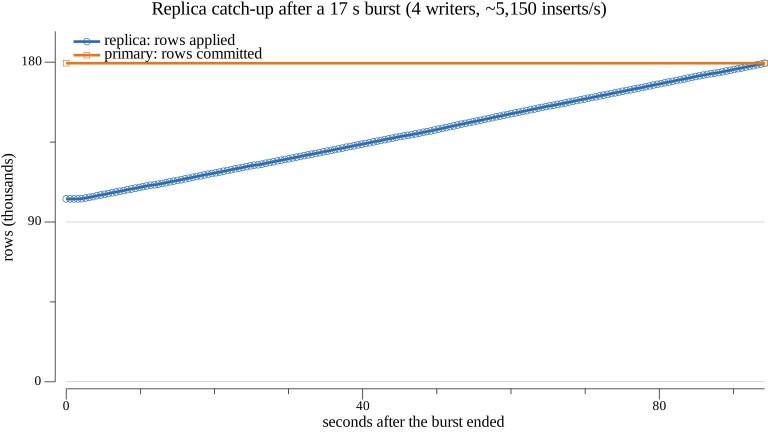
Two things come out of that. First, capturing CDC on the primary costs 16-19% of write throughput. That’s against the
same binary with no [cluster] at all. It’s in the same range as the 12-13% the lab measured on its podman rig.
Second, the replica applies about 750-830 transactions per second. It’s a straight line no matter how hard the primary
is pushed. The reason is in the tailer. poll_batch cuts at the first COMMIT record. So every primary transaction
becomes its own poll, its own frame and its own transaction on the replica. The 25 ms sleep only happens when there’s
nothing to send, so it isn’t the bottleneck here. The per-transaction round trip is. The obvious next step is batching
several source transactions per frame and per apply transaction. Now there’s a number to beat.
During those bursts the replica also logged SQLITE_BUSY from apply_batch twice. Both were an apply colliding with
my read probe on the replica. Both times it dropped the stream and resubscribed two seconds later from its watermark,
then carried on. The final count on both nodes was 179,369 rows. That’s the “lag, not loss” property from the
backpressure section doing its job. A busy timeout on the apply connection would make it a lot less noisy, though.
How I measured
- AMD Ryzen 9 5950X (16 cores / 32 threads), 128 GB (62 GiB visible to WSL2), Windows 11 with WSL2 (kernel 6.18.33.2), everything on the WSL ext4 filesystem. No CPU limits on either node, so both ePHPm processes and the load generator share the same 32 threads.
- ePHPm v0.8.7, the
php8.4.23-linux-x86_64release build,[db.sqlite.replication] role = "primary"/"replica"pinned,[php] mode = "fpm", rate limiting off, query stats off. - PHP fixtures use
ephpm_db_execute/ephpm_db_query, one statement each. The lag probe and open-loop writer are a ~150 line Go program. The burst writers are closed loop over keep-alive connections. - One-machine loopback numbers. They say how the replication path behaves, not what a real network between two hosts adds. Absolute inserts/s won’t transfer to your hardware. The shape should: lag tracks the poll interval, and apply has a ceiling around one transaction per round trip.
One database per site
Multi-tenant ePHPm (a sites_dir with a database per vhost) and clustering didn’t coexist until
#416. Before it, enabling [cluster] collapsed every vhost onto one shared
clustered database. With [db.sqlite.replication] per_site = true:
- Each vhost gets its own
cdc/<site>andsnapshot/<site>streams over the same channel connection. - Ownership is rendezvous-hashed over the alive nodes. A node death moves only that node’s sites, each to a node that already has a warm replica.
- A new
sql/<site>stream forwards writes from a non-owner to the owner, so they get captured into that site’s CDC log.
A review of the PR listed its own blockers, and they were closed before merge. The worst was data loss when a site got re-homed onto a node that never had it. A node joining was enough to trigger it. Two more silent ones came after:
- A node that only forwarded a site never replicated it (#429).
- Stock
pdo_mysqlwrites on a non-owner committed locally and were never shipped (#432).
Every health check was green in both cases. The lab’s cluster suite puts the forward hop at about 255-275 µs per statement. It’s paid per statement, so a ten-query page on a non-owner pays it ten times.
Counting protocols
Here’s the closing argument for the series. In the sqld era, two nodes talked over four things:
- Gossip.
- The KV data plane.
- sqld gRPC.
- Hrana HTTP to a child process on each side.
Now it’s gossip, the KV data plane, and one multiplexed, authenticated cluster channel, all in one process.
ePHPm’s docs still label clustered mode experimental, and I think that’s right. That label is about ePHPm’s replication layer, not about Turso. The layer is a couple of months old and has had real bugs in its election and watermark logic. The fixes for those bugs came with tests that fail without them. That’s the best I can offer until it has more time behind it.
Links
- #186 Phase 2 CDC-native replication, litewire#10
- #219 cdc_listen removal, cluster channel docs
- #310 clustered Turso CDC e2e, #346 election and log identity fixes, #353 log id in the claim
- #416 per-site clustered replication, #429, #432
- Cluster channel design: ephpm.dev/roadmap/cluster-channel
- Lab cluster suite results: cluster-persite-v087.md