An Upstream PHP JIT Use-After-Free, and Why Our Default Flipped Twice
ePHPm turned PHP's tracing JIT on by default, then off three days later when stock Laravel died after three requests. The bug was upstream, and this is the bisect, the root cause and where the fix landed.
In August, ePHPm turned PHP’s tracing JIT on by default in single-site serve mode.
Three days later it went back off on every platform, and it’s still off. The reason turned out to be a use-after-free
in PHP’s tracing JIT that has nothing to do with ePHPm. Stock php -S with a stock Laravel skeleton dies on it in a
couple of requests. The fix is now released upstream. So this seemed like the right time to write up how we got there,
and what still has to happen before the default can flip again.
Flip one: on, because the numbers said so
ePHPm had kept the JIT off since July for a measured reason. On our cpu.php benchmark, opcache.jit=tracing cost
17% RPS. That benchmark spends most of its time in the hash() builtin. JIT compiles PHP bytecode. When the hot code
is a C builtin there’s nothing for it to compile, so the tracing overhead is pure cost.
Then the Windows performance work happened. MSVC-built PHP gets the slowest VM dispatch mode. On a pure-PHP CPU loop on my Ryzen 9 5950X, the JIT took a request from 5.56 ms to 2.33 ms. So ephpm#350 shipped a shaped default and not a global one:
| Mode | default |
|---|---|
single-site ephpm serve |
tracing |
multi-tenant (sites_dir) |
disable |
| worker mode | disable (pending a soak) |
ephpm dev |
off |
Multi-tenant stayed off because of a second measurement. Per-site opcache_invalidate() never reclaims JIT buffer.
buffer_free doesn’t move. Only a full opcache_reset gets it back, and the hardening preset disables that. In a host
where tenants deploy all day, the buffer would fill and the JIT would quietly stop compiling. There’s a knob
([php] opcache_jit = "tracing" | "function" | "disable"). There’s a startup line that says what the JIT is doing and
why, plus two gauges for buffer size and free space.
The PR’s own risk section named the worst case of turning it on: “a JIT miscompile… a process-level SIGSEGV/access violation with no crash containment”. That’s what happened.
Flip two: off, because Laravel died after three requests
ephpm#365 was a Windows release build serving a stock Laravel 13 app
with the default config. It died with 0xC0000005 after exactly three requests. Deterministic. ePHPm logged nothing,
because there’s no fatal-signal handler on Windows. The process just vanished.
It was found during an experiment with an in-memory code bundle. It got blamed on that experiment twice before the right control was run. With the bundle feature switched entirely off, it still crashed 3 out of 3. These are the controls that pinned it on the JIT:
opcache.jit=disablesurvived 150 requests every time.- A unique
opcache.cache_iddidn’t help, so it wasn’t the OPcache ASLR collision from earlier that same day. It did look a lot like it. - None of the ePHPm-side levers helped either. That covered one worker, the dedicated pool (which only delayed it to request 35), and a smaller JIT buffer.
A crash dump symbolized to the same frames every time:
php8ts!zend_jit_escape_if_undef+0x103        <- mov rcx,qword ptr [rax+rcx*8+0D0h]
php8ts!zend_jit_trace_deoptimization+0x500
php8ts!zend_jit_trace+0x961
php8ts!zend_jit_compile_side_trace+0x1c3
php8ts!zend_jit_trace_hot_side+0x47f
php8ts!zend_jit_trace_exit+0x7fb
0x00001000`10000644                          <- side exit out of JIT'd code
Read it bottom-up. JIT-compiled code took a side exit and the exit got hot. So the JIT started compiling a side trace
for it. While doing that it read through a pointer into an unmapped heap region. The faulting read is
op_array->reserved[0], which is ZEND_FUNC_INFO(exit_info->op_array) in zend_jit_ir.c.
Bisecting it without ePHPm
The fastest way to stop arguing about whose bug it is: take your own code out of the picture. I used the same Laravel
app with official Windows x64 TS builds from php.net and plain php -S. The ini had OPcache and
opcache.jit = tracing. Each cell was 150 requests in its own process. Every cell checked that
opcache_get_status()['jit']['on'] was really true. My first pass had a false negative on 8.4. OPcache is a separate
DLL there and I hadn’t loaded it.
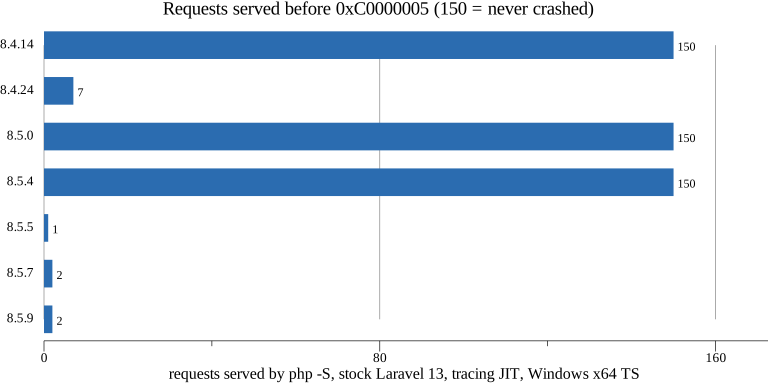
| PHP (Win x64 TS) | requests served |
|---|---|
| 8.4.14 | 150, clean |
| 8.4.24 | 7, then 0xC0000005 |
| 8.5.0 | 150, clean |
| 8.5.4 | 150, clean |
| 8.5.5 | 1, then 0xC0000005 |
| 8.5.7 (our pinned SDK) | 2, then 0xC0000005 |
| 8.5.9 (latest at the time) | 2, then 0xC0000005 |
That window brackets one change on both branches. php-src#21368 was a fix for a JIT infinite loop. It merged to PHP-8.4 on March 16th and was first released in 8.4.20 and 8.5.5. There was already an open upstream fix attempt, php-src#21710 from Ilia Alshanetsky. It was chasing a crash another user had hit under IIS with FastCGI. Arnaud Le Blanc had posted the root cause there the week before.
The root cause
When the tracing JIT creates an exit point, it records the op_array the trace was in. That way it can find the
function’s metadata later. It took that pointer from the current call frame. Usually that’s the op_array in OPcache
shared memory, which lives as long as the cache. Methods of a class whose parent isn’t in shared memory are
different. Class linking copies the method’s op_array header to the request heap, and that copy is what’s on the
frame. The copy is freed at request shutdown. The trace metadata lives on in shared memory.
So request 1 records a trace through such a method, and the exit point keeps a pointer to the heap copy. Request 2
takes that exit often enough to make it hot. The JIT compiles a side trace, follows exit_info->op_array, and reads
freed memory. Whether that crashes depends on what the allocator did with the memory in between. That’s why the request
count varies by version and app.
Why Windows first? Upstream’s guess matches what I saw. On Windows, linked classes miss the inheritance cache more
often. But it’s not Windows-only. On Linux under ePHPm, 20,000 requests of stock Laravel were clean. Then one route
linking a class whose parent wasn’t in shared memory died at request 2, five runs out of five. The same route under
stock php -S on Linux died at request 2 too, on 8.5.7 and 8.4.23. And eval is just one way to get an uncached
parent:
how the parent class is provided (stock php -S 8.5.7) |
result |
|---|---|
eval("class P {}") |
dies at request 2 |
| ordinary file, OPcache-blacklisted | dies at request 2 |
| ordinary cached file | 200/200 clean |
cached file, declared under if (!class_exists(...)) |
200/200 clean |
Mock and proxy generators (PHPUnit, Mockery, ProxyManager) generate exactly this kind of class. So does an oversized or
blacklisted parent file. So the exposure isn’t “apps that use eval”. It’s any app where some class extends a parent
OPcache didn’t cache.
The default goes off everywhere
ephpm#372 started as a Windows-only change. Re-testing the “Linux is an
accepted risk” assumption is what produced the Linux numbers above. By the time it merged the default was disable on
every platform. The startup line says why:
INFO ephpm: opcache JIT OFF — default since #365: PHP's tracing JIT (8.5.5+, and 8.4.24+)
reads a freed op_array when it compiles a side trace in a later request and kills the
process — no PHP error, no log line (php-src PR 21710, still open; reproduces on stock php
too, on Linux and Windows alike). Set [php] opcache_jit = "function" for the unaffected JIT
mode, or "tracing" to accept the risk
The “8.4.24+” in that line undersells it. On the 8.4 branch the regression first shipped in 8.4.20.
Two other workarounds held in testing:
opcache.jit=functionnever builds traces, so it can’t get to this code.opcache.jit_hot_side_exit=0keeps root traces and never compiles a side trace.
I didn’t make the side-exit setting the default. The other reporter saw a different faulting site after changing JIT
flags. That says the stale pointer can bite in more than one place. Turning off side traces also removes most of what
the tracing JIT is worth anyway. "function" is documented as the middle setting for anyone who wants some JIT.
What it cost us is small. On the real Laravel app, the tracing JIT used about 0.3 MB of its 64 MB buffer over 20,000 requests. There’s just not much for it to compile in a request/response app. The big wins were on synthetic CPU loops. The failure mode is a silent process kill that takes every in-flight request with it. Easy call.
Upstream
The Laravel reproduction and the bisect went onto php-src#21710 on August 22nd. That was mostly because it was a
simpler repro than the existing ones. No IIS, no FastCGI, no pcntl_fork, just php.exe -S and a skeleton app dying
in seconds. Ilia Alshanetsky committed the fix two hours later, “JIT: persist the SHM op_array in trace exit_info”:
exit_info.op_array was taken from the current frame. Methods of linked classes that miss the inheritance cache use a heap copy of the op_array header, so that pointer is invalid in other processes and later requests. Store the original from the JIT extension, as root traces already do.
The PR was closed as landed on August 24th. The fix shipped in PHP 8.4.26 and 8.5.11, tagged September 22nd and released on the 24th. I checked the release tags against the fix commit, and both contain it. Our php-sdk pipeline published 8.5.11 and 8.4.26 builds at the end of September.
For this post I also tried to build a toy reproducer to show 8.5.9 crashing and 8.5.11 not. It used an eval’d parent
and a child class with a method that sees a different type each request. I couldn’t get the toy to crash on 8.5.9. The
JIT debug output did show it compiling a side trace off the method’s root trace. My best guess is that the stale read
happens but lands on memory that’s still mapped. The real apps crashed because their allocation pattern had reused or
released that memory by the time the side trace compiled. That’s the nature of a use-after-free. It’s also why I’m not
going to call the fix verified on our side until the Laravel cell from the table above runs clean on 8.5.11.
What has to happen before it flips a third time
As of today ePHPm’s SDK pins are still 8.4.23 and 8.5.7. Both are affected, so the default stays disable. The comment
on the reason enum already says to revisit “when php-src PR 21710 merges and the pinned SDK is bumped past it”. The
first half is done. For the second half the bar is:
- Bump the pins to 8.4.26 and 8.5.11 or later.
- Re-run both bisect fixtures on the new SDKs with
opcache_jit = "tracing"forced on. That’s the Windows Laravel skeleton and the Linux uncached-parent route. - Only then reconsider the single-site default, and only there. The multi-tenant reason for keeping it off (buffer that never comes back) has nothing to do with this bug.
The broader lesson for me is about which default to pick when the upside is a benchmark and the downside is a crash with no log line. The JIT made a synthetic loop 2.4x faster. It did roughly nothing for a real Laravel app. And it had a known-unknown failure mode that our own risk section called out. A default like that should be something you opt in to, at least until the upstream bug class has been quiet for a while.
Links
- ephpm#350 - shaped JIT default (on in single-site serve)
- ephpm#365 / ephpm#372 - stock Laravel dies after 3 requests; JIT default off everywhere
- php-src#21368 - the change that introduced the regression
- php-src#21710 - root cause, reproducers and the fix discussion
- php-src commit 7873640 - “JIT: persist the SHM op_array in trace exit_info”
- ePHPm benchmarking findings - the JIT that made
cpu.php17% slower