From 52% to 100%: Measuring a Go Client Against the Proxmox API Schema
I built a stdlib-only mage target that pulls Proxmox's own API schema and regex-scans go-proxmox for HTTP call sites to report coverage. The tool was wrong more often than the code was.
For five years the honest answer to “how much of the Proxmox API does go-proxmox cover?” was “a lot of it? the parts people asked for?”. Issues would come in for endpoints that didn’t exist in the client. I’d have no idea how many more were missing. At the end of May I finally built the thing that answers the question. Three days after the first run the answer was 100%. The more interesting part is how many times the measuring stick was wrong on the way there.
Proxmox publishes its schema, sort of
The API viewer is an ExtJS app. The whole API definition lives
in one file next to it: apidoc.js. It’s a JavaScript file, not JSON, but it starts with const apiSchema = [ and the
array is valid JSON. Each node in the tree has a path segment (text), an info map keyed by HTTP method, and
children. Flatten that and you have every (method, path) pair Proxmox serves.
The first gotcha is getting the array out. The obvious “first [ to last ]” breaks. Below the schema the file has the
viewer’s own code, including template literals like ${m2c[method]}. That’s the last ] in the file. The array is
pretty-printed with the closing bracket on its own line followed by the semicolon. So that’s the anchor:
// extractSchemaJSON peels the `const apiSchema = [ ... ];` array out of the
// upstream JS file. We anchor on `\n]\n;` rather than the last `]` because
// the JS handler code below the schema contains template literals like
// `${m2c[method]}` whose `]` would be matched first.
func extractSchemaJSON(raw []byte) ([]byte, error) {
	start := bytes.IndexByte(raw, '[')
	endIdx := bytes.Index(raw, []byte("\n]\n;"))
	if start < 0 || endIdx <= start {
		return nil, fmt.Errorf("could not locate JSON array boundaries in apidoc.js")
	}
	return raw[start : endIdx+2], nil
}
On PVE 9.2.1 that’s 675 endpoints across 444 unique paths: 340 GET, 173 POST, 83 PUT and 79 DELETE.
Scanning Go with regular expressions
The other side is “which of those does the library call”. Every HTTP call in go-proxmox goes through
client.Get/Post/Put/Delete(ctx, path, ...). The path is nearly always a fmt.Sprintf with the Proxmox path as the
format string. So it’s a regex per line. Then both sides get normalized so {node}, %s and %d all become {}:
callRE = regexp.MustCompile(`\b\w+\.(Get|Post|Put|Delete)(?:WithParams)?\s*\(\s*ctx\s*,\s*(.*?)$`)

func normalizePath(p string) string {
	if i := strings.IndexByte(p, '?'); i >= 0 {
		p = p[:i]
	}
	p = braceRE.ReplaceAllString(p, "{}")
	p = fmtVerbRE.ReplaceAllString(p, "{}")
	p = volidRE.ReplaceAllString(p, "{}")
	if len(p) > 1 {
		p = strings.TrimRight(p, "/")
	}
	return p
}
The volidRE is there because storage volumes are a single {volume} segment in the schema. The Go code builds them as
%s:%s/%s. I considered walking the AST instead, and didn’t bother. The regex resolved 98.4% of call sites on the first
run. The rest were real, just in unusual shapes. The whole thing is mage/endpoints/endpoints.go, standard library
only. It has three targets:
endpoints:syncdownloads and flattens the schema into.cache/pve-api/endpoints:extractre-parses offlineendpoints:coveragewrites the uncovered list and a per-area table
The first run (#298) said 353 of 675, 52.3%. The cluster
area was at 94 of 259. Ceph, node SDN and node scan were at zero.
The tool was wrong before the code was
Then I started using it to decide what to write next. I kept finding that “missing” meant “the scanner can’t see it”.
url.URL{Path: ...}.String()(#300). Calls that need query parameters build aurl.URL, setRawQuery, and passu.String(). The regex matched the call and then found no string literal. Tracking<var> := url.URL{Path: ...}per file uncovered nine endpoints that were already wrapped. One wasRRDData, which was next on the list to “add”. Fixing the tool first saved writing a duplicate.- Websocket helpers (in #306).
VNCWebSocketandTermWebSocketdon’t take a context, soctx,never matched. *WithParamsvariants (#313).Container.DeleteusesDeleteWithParams, soDELETE /lxc/{vmid}showed as missing for a method that has existed for years.- Directory-index helpers and uploads (#318,
#321). Shared
<area>Diridxhelpers andclient.UploadReader(with the path on the next line both needed their own rules. The upload one needs a little state machine. When the regex matches with nothing after the(, it takes the path from the next non-blank, non-comment line. It gives up after one line so a stray match can’t bind to something far below it.
Every one of those made the number go up without a line of library code changing. If you build a coverage tool, the first few days are spent finding out what it can’t see. The only way to find that out is to distrust every “missing” until you’ve looked at it.
Endpoints we skip on purpose
A few endpoints don’t fit Get/Post/Put/Delete at all. I didn’t want the number stuck at 99.6% forever. I also didn’t
want people writing fake wrappers to make it move. So there is an explicit exclusion map with a reason per entry:
var intentionallyExcluded = map[string]string{
	"get /nodes/{}/qemu/{}/mtunnelwebsocket":         "URL-builder helper (MigrationTunnelWebSocketPath); caller drives the websocket dialer",
	"get /nodes/{}/lxc/{}/mtunnelwebsocket":          "URL-builder helper (MigrationTunnelWebSocketPath); caller drives the websocket dialer",
	"get /nodes/{}/storage/{}/file-restore/download": "streaming binary download; needs custom io.Reader plumbing, not the JSON Get helper",
}
Excluded endpoints come out of the denominator, so the headline is 672, not 675. The important detail is that every coverage run checks the map against the live schema. It fails if an entry no longer exists upstream. An exclusion list that silently outlives the endpoint it excludes is how you end up hiding a regression.
Directory-index endpoints (the ones that return [{"subdir": "x"}, ...]) looked like obvious exclusion candidates. They
are deliberately not on the list. They’re real, callable endpoints that any token can hit, and they’re cheap to wrap.
Keeping them in the denominator means the scanner’s Diridx rule gets exercised. So they got real wrappers.
May, by commit
With the tool trustworthy the rest was work. Ceph went from 0 of 41 to 41 of 41 in one PR. qemu went from 81% to all of
it. #322 closed the last 38 cluster endpoints (config, custom CPU
models, bulk actions, Ceph flags, HA arm/disarm and friends). That was the final step in taking cluster from 36% at
the start of the week to 259 of 259.
I re-ran the final version of the scanner over every commit that landed on main in May to get the curve:
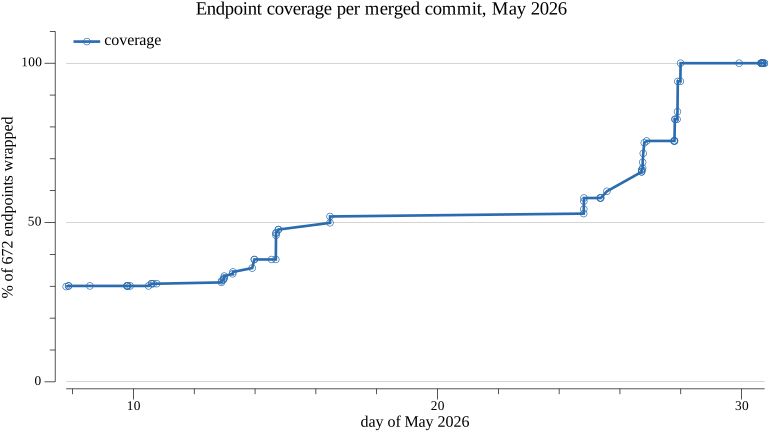
The flat stretch from the 16th to the 24th is a stack of open PRs waiting on review. The jump late on the 24th is them landing. The vertical bits on the 26th and 27th are the Ceph, SDN, node and cluster sweeps. Today, on v0.7.1:
go-proxmox endpoint coverage
  schema endpoints   : 675
  call sites scanned : 698 (matched=698, no-match=0 → match rate 100.0%)
  unique covered     : 672 / 672  →  100.0%  (excluded by design: 3)

area                       covered    total excluded  missing      pct
cluster                        259      259        0        0   100.0%
nodes/qemu                      96       97        1        0   100.0%
nodes/lxc                       61       62        1        0   100.0%
access                          45       45        0        0   100.0%
nodes/ceph                      41       41        0        0   100.0%
nodes/storage                   19       20        1        0   100.0%
nodes/disks                     18       18        0        0   100.0%
...
Five years of it
The scanner only needs a source tree. So I pointed it at every release tag and a few early commits, all against the same 9.2.1 schema:
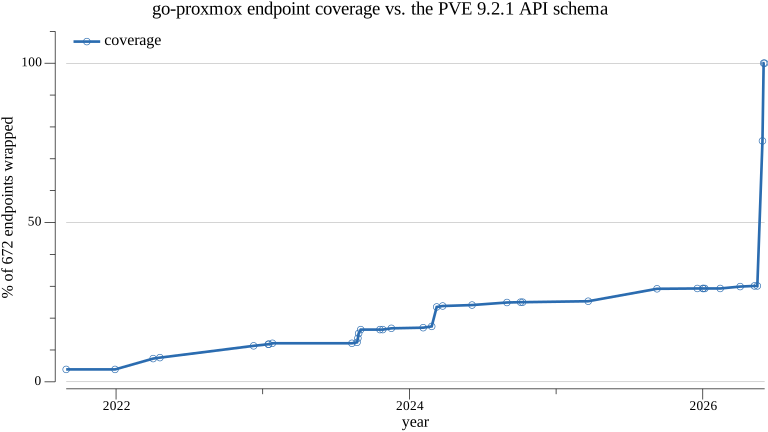
Here’s how it climbed:
- 3.9% in August 2021 (26 endpoints, mostly VMs, containers and storage)
- 11.8% at the first alpha tag in January 2023
- 24.1% at v0.1.0 in June 2024
- 29.3% at v0.3.0 on the last day of 2025
- 30.1% on May 7th of this year
Four and a half years to get to 30%, and three weeks for the other 70.
Two caveats on the old points. Code before October 2023 predates context support. For those I relaxed the call regex to
make ctx, optional. And the very early code built a few paths with string concatenation, which the scanner can’t
resolve. So 2021 and 2022 are probably undercounted by a handful. Also note the first run printed 52.3%. The final
scanner over the same week’s code says 52.8%. That difference is the exclusion list plus the blind spots above.
What 100% doesn’t mean
It means every endpoint in the schema has at least one Go call site. It says nothing about three other things:
- whether the request and response types are right
- whether a zero value in a struct quietly overrides a Proxmox default
- whether a JSON tag has a typo in it
That’s a different audit and it found plenty, which is its own post. The scanner’s job now is to be a gate. AGENTS.md
says new wrappers should move the number in the right direction. If the scanner can’t see a new wrapper, teach the
scanner rather than adding to the exclusion list.
How I measured
- Schema:
apidoc.jsextracted from thepve-docs_9.2.1_all.debpackage ondownload.proxmox.com(trixie, pve-no-subscription). That’s 675 endpoints. Old and new code are measured against the same API. - Scanner:
mage/endpoints/endpoints.gocopied verbatim frommaininto a scratchmainpackage. A tiny harness takes a schema path and a source directory. For pre-2023-10 revisions only, the call regex’sctx\s*,is optional. - Revisions: every release tag from
v0.0.0-alpha1tov0.7.1and five early commits. Those are the last commit before 2021-09-01, 2022-01-01, 2022-04-01, 2022-07-01 and 2023-01-01. I added every first-parent commit onmainfrom May 7 to May 31, 2026. All were extracted withgit archive <rev> | tar -x. - Machine: Windows 11, Go 1.26. The chart is the “unique covered” line from each run.